In Simple Words
Think of taking a car to a master mechanic for a full 100-point inspection before starting a long cross-country trip. Instead of guessing why the engine sputters, the mechanic hooks up diagnostic tools, tests every part, and gives the driver a prioritized list of exact repairs needed to prevent a highway breakdown.
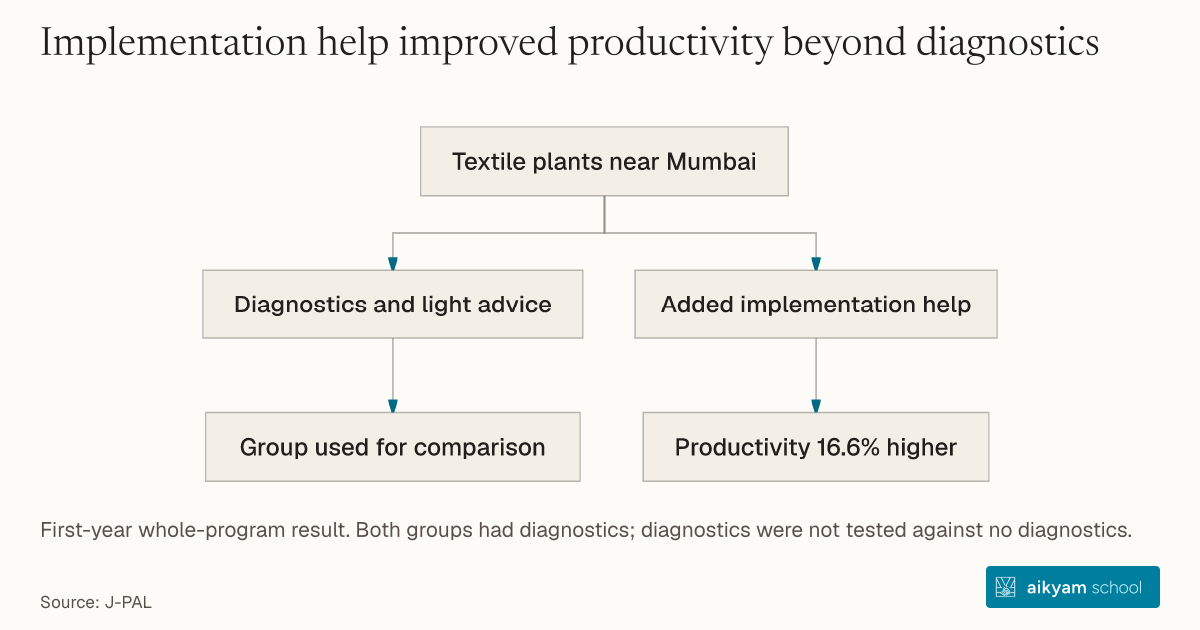
Textile plants near Mumbai
- Diagnostics and light advice
- Group used for comparison
- Added implementation help
- Productivity 16.6% higher
All experimental plants received diagnostic consulting. The card’s 16.6% productivity gain concerns added implementation help, not a separate diagnostic effect. First-year whole-program result. Both groups had diagnostics; diagnostics were not tested against no diagnostics. Both groups received diagnostics and light follow-up advice; treatment plants received added implementation help.
See source →Research question
Firm owners frequently lack objective visibility into factory-level operational defects and inefficiency root causes across complex multi-building production sites.
Participants
N = 17 large manufacturing textile firms (28 plants total) in Mumbai, India, with average sales of US$7.5 million and assets of US$13 million.
Study Design
Randomized Controlled Trial (RCT) involving an initial 15-day diagnostic evaluation phase per plant over one month to analyze management practices and assemble a plant-level metrics database.
Results
Providing a 15-day structured diagnostic analysis and tailored recommendations established the baseline performance database required to drive a subsequent 16.6% total factor productivity increase.
Takeaway
Conduct an intensive 15-day operational diagnostic across production facilities to evaluate current practices against international benchmarks and build a centralized baseline metrics database.
Source and citation
See source →Read alongside the research
Plain-English glossary
Original explanations, informed by the references below. Examples are illustrations, not data from the studies above. The research text stays unchanged.
- Baseline
The starting measurements in a study. Researchers use these to compare what participants were like at the start with what happens later.
ExampleBefore a training programme starts, researchers measure workers’ earnings. That first measurement is the baseline.
GET-IT glossary · Baseline characteristics ↗Read more about baseline →- Randomized controlled trial
A study that uses chance, like drawing lots, to decide who receives each option being compared. Researchers compare the groups’ outcomes to estimate the effect of those options.
ExampleA lottery assigns volunteers to a training programme or a comparison group. Researchers then compare their outcomes.
GET-IT glossary · Randomized study ↗Read more about randomized controlled trial →