Research groups
Compare explicit demand prompts
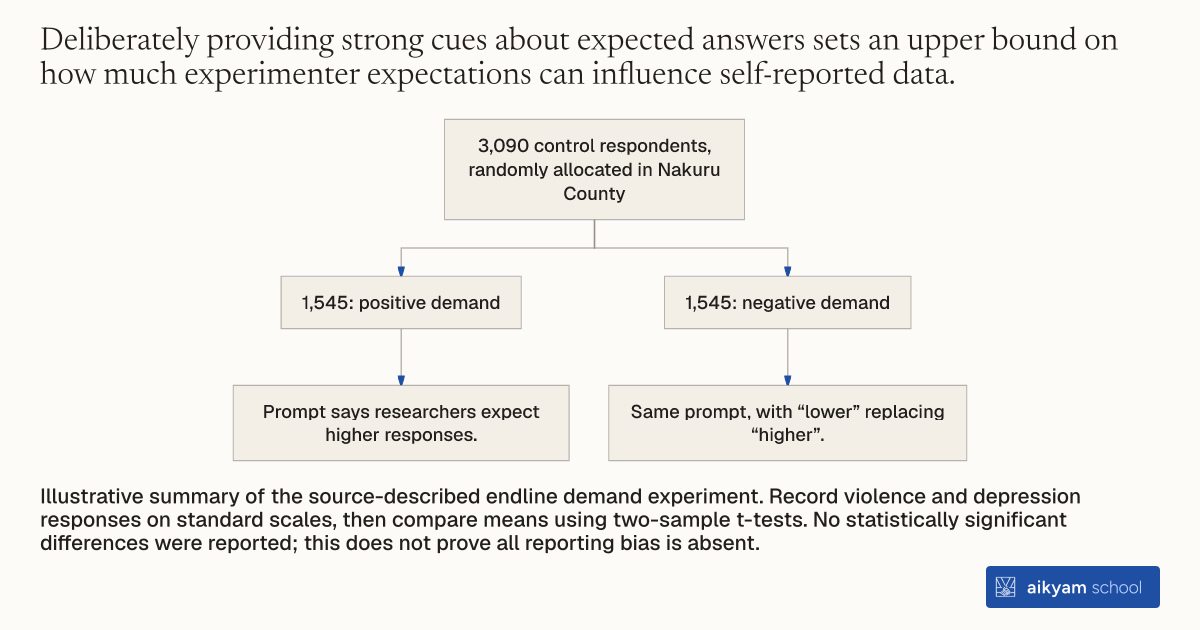
3,090 control respondents, randomly allocated in Nakuru County
- 1,545: positive demand
- Prompt says researchers expect higher responses.
- 1,545: negative demand
- Same prompt, with “lower” replacing “higher”.
Illustrative summary of the source-described endline demand experiment. Record violence and depression responses on standard scales, then compare means using two-sample t-tests. No statistically significant differences were reported; this does not prove all reporting bias is absent.
See source →How
When to use
Field surveys relying on self-reported outcomes risk experimenter demand bias, where respondents adjust their answers to match what they think researchers want to hear. This method bounds the extent of demand bias by deliberately giving respondents explicit positive or negative statements about expected answers. It serves researchers validating self-reported survey measures against social desirability and response bias.
Bound survey response bias by presenting respondents with explicit hypotheses that encourage higher or lower self-reports across sensitive questions.
- Survey designers identify key self-reported survey items susceptible to experimenter demand bias, such as intimate partner violence or depression scores.
- Field officers randomly allocate survey respondents in the control group into either a positive demand treatment arm or a negative demand treatment arm.
- Field officers read a prompt to positive demand participants stating that researchers hypothesize participants will give higher responses to the target question.
- Field officers read the same prompt to negative demand participants, substituting the word higher with lower.
- Field officers record responses to the target self-report questions across both demand arms using standardized response scales.
- Data analysts perform two-sample t-tests comparing mean responses between positive and negative demand conditions to evaluate whether demand signals alter reported outcomes.
Why it works
If participant responses do not change significantly when explicitly instructed on expected outcomes, experimenter demand bias can be ruled out as a driver of treatment effects.
Example
At endline in Nakuru County, Kenya, researchers delivered explicit positive and negative demand prompts to 3,090 control group participants across questions on domestic beatings, forced intercourse, and depression. Mean responses between positive and negative demand conditions were nearly identical (4.65 vs. 4.62 for beatings; 2.79 vs. 2.76 for forced intercourse; 3.43 vs. 3.42 for depression), confirming that experimenter demand effects did not bias self-reported outcomes.
About the study
Participants
3,090 control group participants (1,545 in positive demand, 1,545 in negative demand) in rural Nakuru County, Kenya.
Study Design
A randomized demand experiment embedded in the endline survey of an RCT, assigning control respondents to positive or negative demand treatment prompts for self-reported physical violence, sexual violence, and depression questions.
Results
Responses under positive versus negative demand prompts showed no statistically significant differences for physical violence (4.65 vs. 4.62, p=0.89), sexual violence (2.79 vs. 2.76, p=0.68), or depression (3.43 vs. 3.42, p=0.71), ruling out experimenter demand bias.