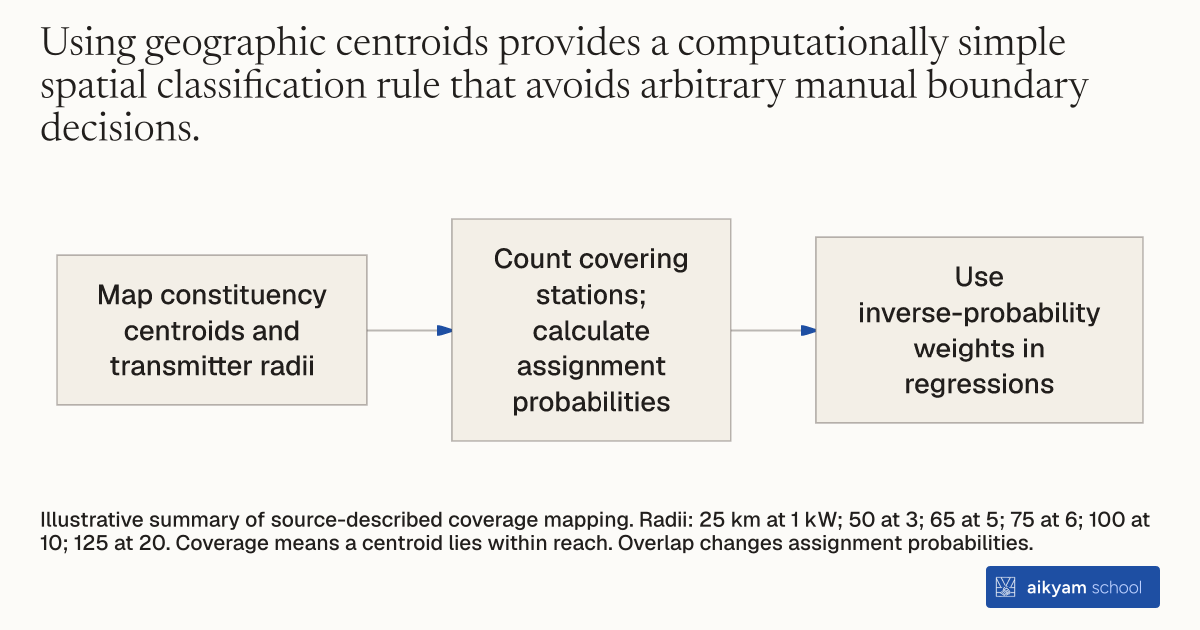
Research steps
Map coverage and weight exposure
- Map constituency centroids and transmitter radii
- Count covering stations; calculate assignment probabilities
- Use inverse-probability weights in regressions
Illustrative summary of source-described coverage mapping. Radii: 25 km at 1 kW; 50 at 3; 65 at 5; 75 at 6; 100 at 10; 125 at 20. Coverage means a centroid lies within reach. Overlap changes assignment probabilities.
See source →How
When to use
Mass media interventions evaluated across geographic administrative units often suffer from overlapping broadcast footprints and non-uniform coverage boundaries. Evaluators need an objective spatial rule to determine which administrative sub-districts fall within a radio station's signal range. Mapping local constituency centroids against transmitter power radii establishes unambiguous treatment exposure and exact assignment probabilities across overlapping clusters.
Map geographic centroids of local administrative units against radio transmitter signal radii to determine cluster coverage and calculate exact treatment probabilities.
- Determine the geographic center point or centroid for each local constituency in the evaluation region.
- Collect technical transmitter power ratings for all public radio stations in the study area.
- Assign a signal coverage radius to each station based on its power rating, ranging from 25 kilometers for 1 kW transmitters to 125 kilometers for 20 kW transmitters.
- Mark a constituency as covered by a radio station if its geographic centroid lies inside the station's radial reach circle.
- Count the total number of broadcasting stations covering each constituency to calculate its exact treatment probability under randomized assignment.
- Apply inverse-probability weights in weighted least squares regressions to adjust for varying treatment probabilities caused by overlapping radio coverage areas.
Why it works
Calculating exact exposure probabilities from station overlaps allows researchers to obtain unbiased average treatment effect estimates through inverse-probability weighting.
Example
Researchers mapped 751 assembly constituency centroids against 60 All India Radio stations across 10 Indian states during the 2014 general elections. Centroid distance mapping established that 570 constituencies had a treatment probability of 0.5, 44 constituencies had a probability of 0.75, and 1 constituency had a probability of 0.875.
About the study
Participants
The study evaluated 615 assembly constituencies across 10 Indian states representing 67 percent of the national population, with 312 treatment constituencies and 303 control constituencies. Residents across sample constituencies were 79.15 percent rural, 59.52 percent literate, and 31.77 percent Scheduled Caste or Scheduled Tribe.
Study Design
Researchers assigned signal radii of 25 km (1 kW), 50 km (3 kW), 65 km (5 kW), 75 km (6 kW), 100 km (10 kW), and 125 km (20 kW) around 60 All India Radio stations. Constituencies were classified as treated if their geographic centroid fell within a station's radius, and treatment effects were estimated using inverse-probability weighted least squares with multi-way spatial clustering.
Results
Mapping identified 570 constituencies with 1 covering station (treatment probability 0.5), 44 constituencies with 2 stations (treatment probability 0.75), and 1 constituency with 3 stations (treatment probability 0.875). Inverse-probability weighted estimation showed that radio ads reduced vote-buyer vote share by 3.5 to 7.1 percentage points.