Research steps
Compare demographic booking responses
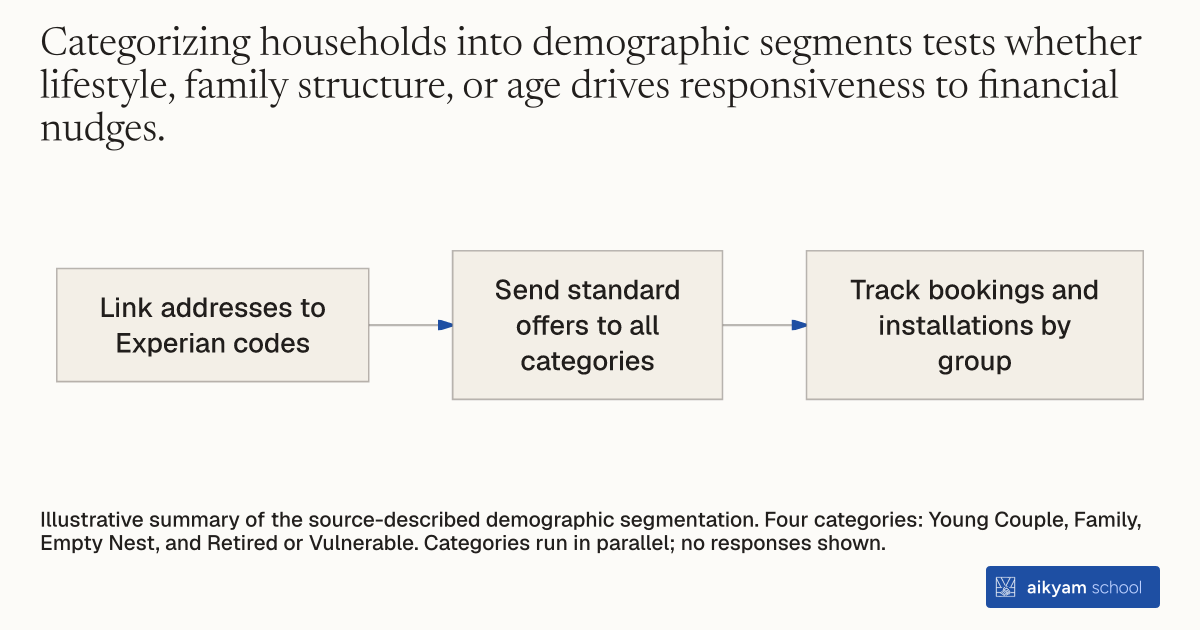
- Link addresses to Experian codes
- Send standard offers to all categories
- Track bookings and installations by group
Illustrative summary of the source-described demographic segmentation. Four categories: Young Couple, Family, Empty Nest, and Retired or Vulnerable. Categories run in parallel; no responses shown.
See source →How
When to use
Utility managers need to know if different population groups respond differently to promotional adoption offers. Categorizing customer households into demographic segments allows organizations to test whether younger or older groups need customized incentive levels. This helps prevent unnecessary spending on demographic-specific promotional campaigns.
Classify customer households by consumer demographic profiles to test whether treatment response varies across age and household types.
- Extract customer residential addresses from administrative account databases.
- Link household addresses to commercial Experian classification databases to assign consumer demographic codes.
- Group customer accounts into four demographic categories: Young Couple households, Family households, Empty Nest households, and Retired or Vulnerable households.
- Deliver standardized direct mail promotional offers across all demographic categories.
- Track appointment booking and installation conversion rates separately for each demographic segment.
Why it works
Discovering uniform response across groups prevents wasting resources on tailored marketing schemes.
Example
British Gas classified 26,025 residential households in the United Kingdom into four Experian demographic segments, finding that £5 and £10 incentive offers produced similar statistically significant adoption increases across all groups.
About the study
Participants
26,025 residential British Gas utility customers in the United Kingdom categorized across Young Couple (N=3,252), Family (N=6,082), Empty Nest (N=3,335), and Retired or Vulnerable (N=13,292) households.
Study Design
Sub-group heterogeneity analysis within a randomized natural field experiment measuring smart meter adoption response across Experian demographic categories under £5 and £10 incentive offers.
Results
The £5 reward increased adoption by 5.0 percentage points in Young Couples (p < 0.01), 6.2 percentage points in Families (p < 0.001), 6.7 percentage points in Empty Nests (p < 0.001), and 6.1 percentage points in Retired/Vulnerable households (p < 0.001); the £10 reward produced similar increases of 5.3, 5.3, 8.7, and 5.9 percentage points respectively.