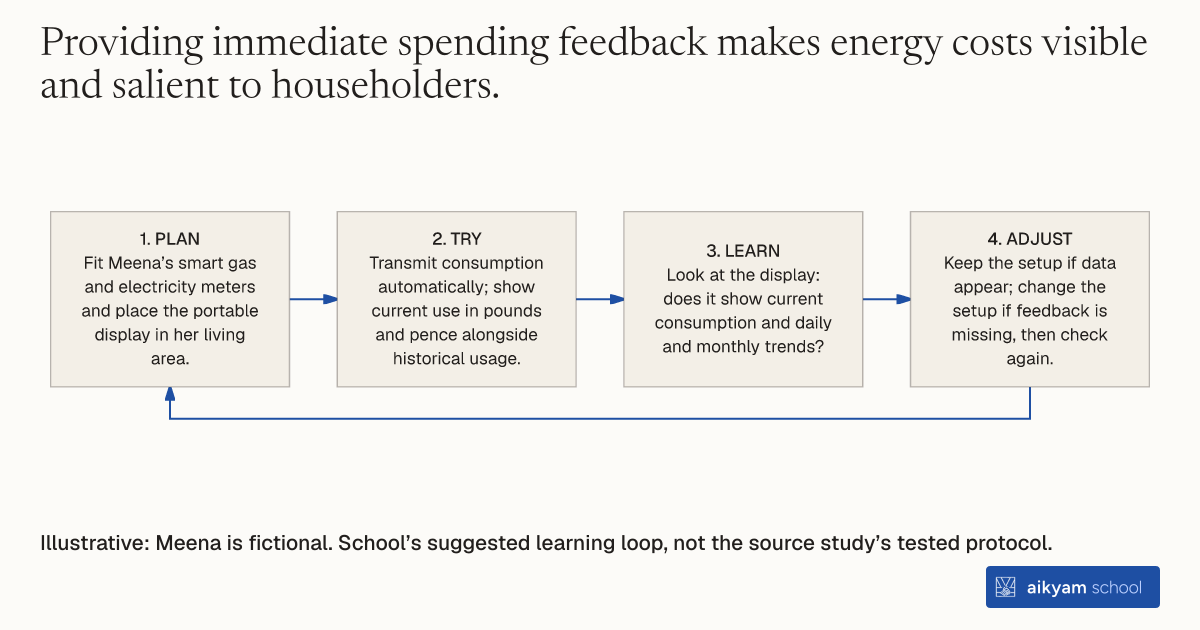
Try, learn and adjust
Check that the home display shows usage
- Plan: Fit Meena’s smart gas and electricity meters and place the portable display in her living area.
- Try: Transmit consumption automatically; show current use in pounds and pence alongside historical usage.
- Learn: Look at the display: does it show current consumption and daily and monthly trends?
- Adjust: Keep the setup if data appear; change the setup if feedback is missing, then check again.
Illustrative: Meena is fictional. School’s suggested learning loop, not the source study’s tested protocol.
See source →School’s suggested learning loop, not a tested protocol. Observe current and historical display information, not assumed energy savings.
How
When to use
Households lack visibility into real-time electricity and gas consumption, making it difficult to understand energy costs. Installing a standalone digital display unit inside the home provides continuous feedback on energy usage. This helps residential utility customers track current spending in monetary units and adjust household appliance use.
Provide households with an in-home display unit connected to smart utility meters to deliver continuous real-time energy usage feedback.
- Install smart gas and electricity meters outside or inside the residential premises.
- Place a portable digital in-home display monitor inside the living area of the customer home.
- Transmit real-time consumption data automatically from the smart meters to the display monitor.
- Show current energy consumption continuously in pounds and pence as usage occurs.
- Provide historical usage data on screen so household members can track daily and monthly trends over time.
Why it works
This allows consumers to make informed choices about turning off appliances or cutting down on energy waste.
Example
British Gas provided smart meters with free in-home displays worth £100 to residential customers in the United Kingdom, but tracking over 1,000,000 monthly usage observations over three years post-installation showed no statistically significant reduction in electricity (-1.29 to -4.13 kWh per month) or gas consumption.
About the study
Participants
Nearly 40,000 residential British Gas households with 1,209,835 monthly electricity observations and 1,216,499 monthly gas observations in the United Kingdom.
Study Design
Two-stage least squares (2SLS) instrumental variables field trial using randomized price incentives as an exogenous instrument to measure the Local Average Treatment Effect (LATE) on monthly electricity and gas consumption over 36 post-adoption months across six econometric specifications.
Results
In-home display feedback produced statistically insignificant electricity usage changes ranging from -4.13 kWh to -1.29 kWh per month (0.4% to 1.4% reduction, standard errors 16.6 to 24.0) and statistically non-significant gas usage changes ranging from -4.09 kWh to +80.54 kWh per month.