Research steps
Map irrigation areas before intervention
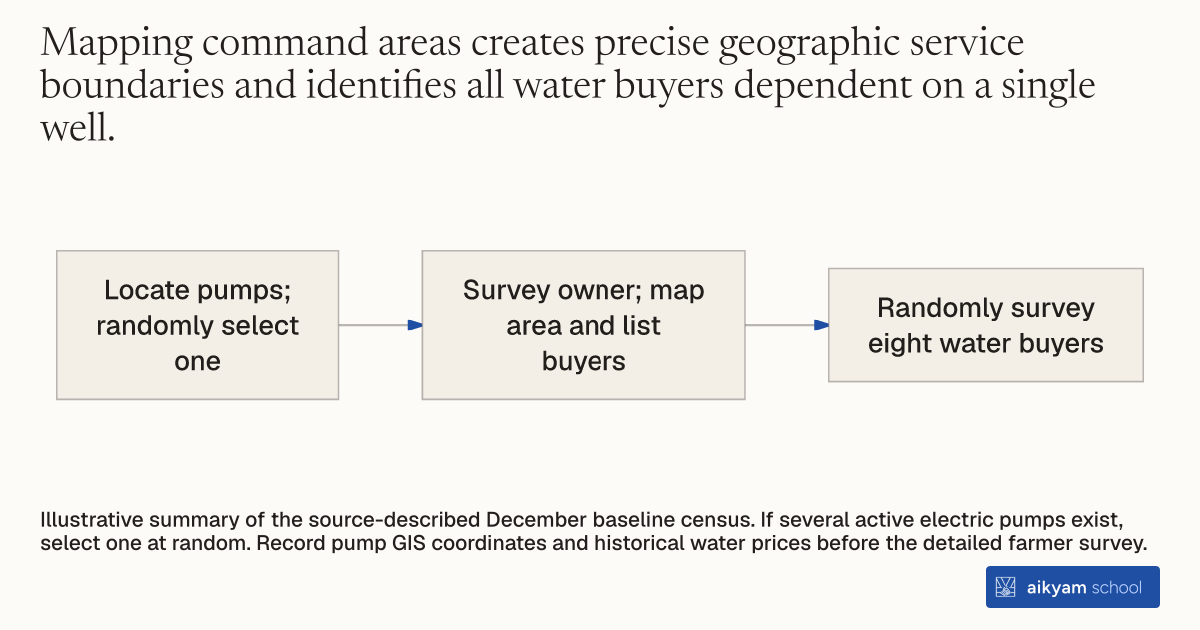
- Locate pumps; randomly select one
- Survey owner; map area and list buyers
- Randomly survey eight water buyers
Illustrative summary of the source-described December baseline census. If several active electric pumps exist, select one at random. Record pump GIS coordinates and historical water prices before the detailed farmer survey.
See source →How
When to use
Smallholder farming areas feature fragmented landholdings served by localized groundwater pumps with unknown customer boundaries. Program managers must map physical service boundaries and enumerate all customer relationships to understand local water markets. This mapping diagnoses command area boundaries and prevents misallocation when delivering group agricultural interventions.
Conduct a spatial census and boundary mapping across localized agricultural irrigation command areas before delivering interventions.
- Send a trained surveyor to each village in December prior to the planting season to identify all active electric groundwater pumps.
- Select one active electric pump at random if multiple pumps operate within the village.
- Conduct a baseline survey with the tubewell owner to collect the GIS coordinates of the pump and historical water prices.
- Record the names of every farmer who buys water from the pump.
- Map the precise geographic spatial GIS boundaries of the entire command area served by the selected tubewell.
- Select eight water-buying farmers at random per command area to complete a detailed individual baseline survey.
Why it works
This spatial census exposes the underlying natural monopoly market structure and owner-farmer decision networks required to design effective interventions.
Example
In December 2018, survey teams mapped 360 electric tubewell command areas across 9 upazilas in Mymensingh and Kishoreganj districts, Bangladesh. The census revealed that each pump irrigated an average of 12.7 to 16 acres divided into 56 plots serving 16 to 19 farmers cultivating an average of 0.71 acres each.
About the study
Participants
N = 360 electric tubewells and command areas serving 2,820 smallholder farmers across 9 upazilas in Mymensingh and Kishoreganj districts, Bangladesh.
Study Design
Spatial mapping and baseline survey census collecting pump GIS coordinates, command area polygon boundaries, owner water contracts, and randomly selecting 8 farmers per command area.
Results
The baseline census established that command areas averaged 13 acres with 16 farmers, where 35.8 percent of plots were irrigated simultaneously with neighbors and tubewell owners helped decide irrigation timing on 74.2 percent of plots.