Research mapping
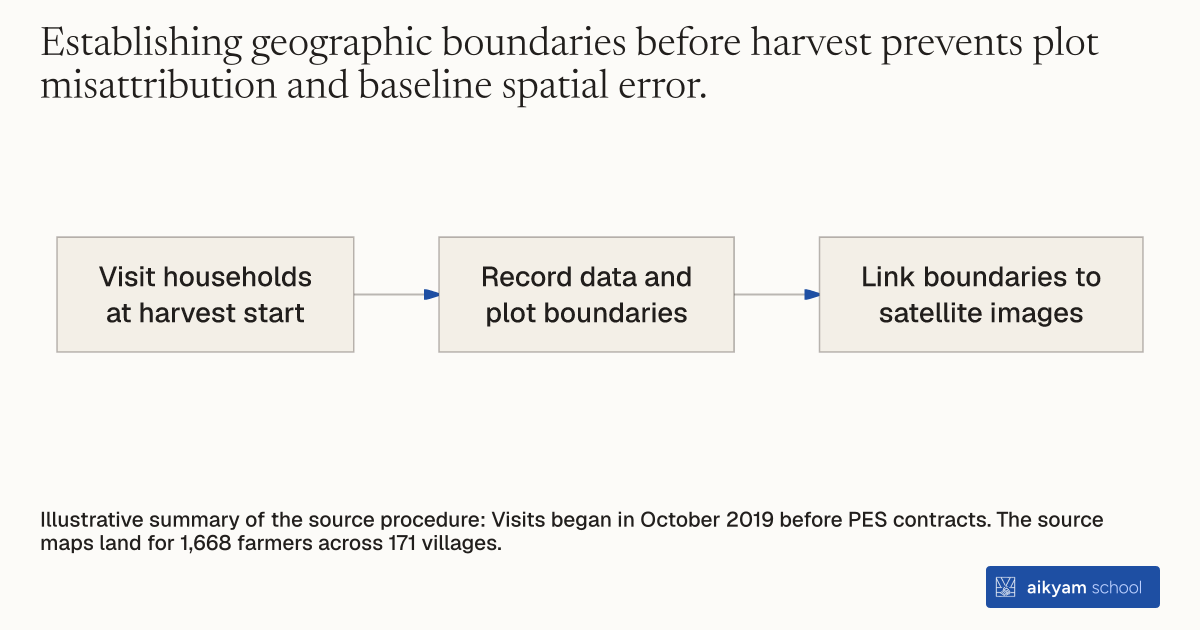
Map plots before harvest contracts
- Visit households at harvest start
- Record data and plot boundaries
- Link boundaries to satellite images
Illustrative summary of the source procedure: Visits began in October 2019 before PES contracts. The source maps land for 1,668 farmers across 171 villages.
See source →How
When to use
Environmental monitoring programs need exact spatial boundaries before harvest to track compliance across individual farmland plots. Without pre-harvest mapping, remote sensing algorithms cannot match specific satellite imagery to enrolled farmers. This mapping method establishes plot-level land boundaries near the start of the harvest season.
Map individual agricultural plot boundaries before harvest to enable remote satellite verification.
- Visit target agricultural households near the start of the rice harvest season in October.
- Collect household baseline demographic and farm operational data.
- Walk or outline the exact physical parameters and boundaries of each paddy plot managed by the farmer.
- Link collected plot geographic boundary coordinates directly to corresponding high-resolution satellite imagery layers.
- Feed mapped plot coordinates into automated monitoring systems prior to contract enforcement.
Why it works
Linking physical plot boundaries to satellite images enables independent remote verification across enrolled and non-enrolled land.
Example
Researchers visited 1,668 enrolled farming households in Punjab, India starting in October 2019 near the start of the rice harvest. They recorded basic household data and defined land plot boundaries to map paddy fields directly to satellite imagery for monitoring.
About the study
Participants
1,668 farmers managing 2 to 12 acres of paddy across 171 villages in Bathinda and Faridkot, Punjab, India.
Study Design
Pre-intervention field boundary collection integrated with GIS mapping and machine learning satellite image classification.
Results
Mapped plot boundaries allowed researchers to track burn outcomes across all study plots, revealing a 90.1% baseline burn rate in comparison villages and a 7.7 percentage point burn reduction under up-front PES.