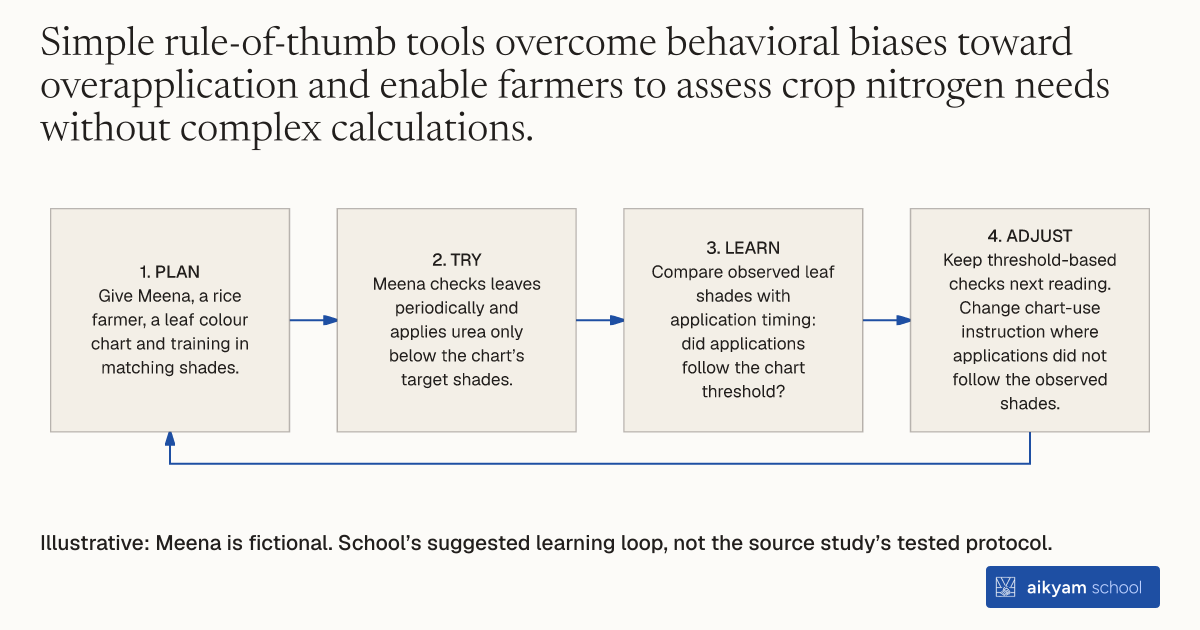
Try, learn and adjust
Check leaf readings guide fertiliser timing
- Plan: Give Meena, a rice farmer, a leaf colour chart and training in matching shades.
- Try: Meena checks leaves periodically and applies urea only below the chart’s target shades.
- Learn: Compare observed leaf shades with application timing: did applications follow the chart threshold?
- Adjust: Keep threshold-based checks next reading. Change chart-use instruction where applications did not follow the observed shades.
Illustrative: Meena is fictional. School’s suggested learning loop, not the source study’s tested protocol.
See source →School’s suggested, untested loop. Observe leaf readings and application timing. The chart’s actual thresholds govern decisions; no new dose is proposed.
How
When to use
Smallholder rice farmers often struggle with optimal fertilizer timing or overapply subsidized nitrogen inputs due to beliefs that more input is always better. Complex scientific instructions for assessing crop nutrient needs make proper dosing hard to determine in real field conditions. This method provides farmers with simple visual rules of thumb to align fertilizer application timing with peak productive growth periods.
Distribute standardized leaf color charts to rice farmers to guide the timing and quantity of urea fertilizer applications.
- Extension officers distribute simple visual leaf color charts to target rice farmers during group training sessions.
- Extension trainers instruct farmers on how to match live crop leaf shades against the chart's color gradient panels.
- Rice farmers take periodic visual readings of crop leaf color directly on their fields throughout the growing cycle.
- Rice farmers compare observed leaf color against chart thresholds to identify nutrient deficiencies during critical productive periods.
- Rice farmers apply urea fertilizer only when leaf colors fall below specified target shades to achieve optimal application timing and quantity.
Why it works
Visual comparison aligns fertilizer application timing with peak crop growth demands.
Example
In Bangladesh, providing rice farmers with leaf color charts enabled farmers to correct application timing and optimal urea quantities during productive periods in the growing cycle, overcoming the behavioral bias that more fertilizer is always better.
About the study
Participants
Smallholder rice farmers in rural Bangladesh.
Study Design
Randomized controlled trial evaluating the impact of rule-of-thumb instructions and visual leaf color charts on fertilizer management.
Results
Providing rice farmers with leaf color charts aligned fertilization timing with productive periods during the growing cycle and improved knowledge of effective fertilizer management through optimal quantity and timing.