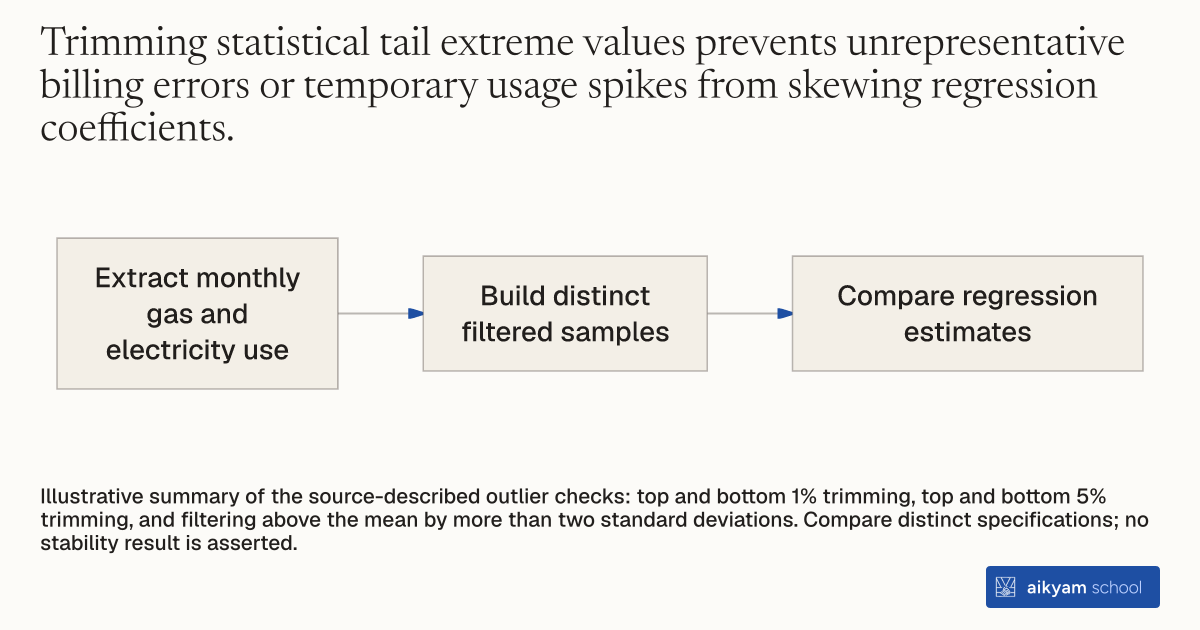
Research steps
Check sensitivity to extreme usage
- Extract monthly gas and electricity use
- Build distinct filtered samples
- Compare regression estimates
Illustrative summary of the source-described outlier checks: top and bottom 1% trimming, top and bottom 5% trimming, and filtering above the mean by more than two standard deviations. Compare distinct specifications; no stability result is asserted.
See source →How
When to use
High-frequency utility consumption datasets often contain extreme measurement anomalies and data errors. Applying multiple outlier trimming thresholds removes artificial extreme values across different statistical boundaries. This allows researchers to test whether regression results remain robust across varying sample trimming rules.
Apply systematic percentile trimming and standard deviation filtering rules across multiple regression specifications to eliminate extreme consumption anomalies.
- Extract raw monthly household electricity and gas consumption observations from utility billing systems.
- Remove extreme upper and lower tail observations by trimming the top and bottom 1% of usage values.
- Apply a secondary percentile filtering rule by trimming observations falling outside the top and bottom 5% tail thresholds.
- Calculate mean consumption and standard deviation parameters across the remaining monthly usage sample.
- Exclude further individual observations that exceed two standard deviations above the average household consumption level.
- Run primary econometric estimation models across each distinct trimmed sample specification to verify parameter stability.
Why it works
Reporting results across multiple sensitivity thresholds demonstrates that findings are not artifacts of a single arbitrary data filtering choice.
Example
Researchers applied six distinct trimming and filtering specifications to over 1,200,000 monthly usage observations from British Gas households in the United Kingdom, confirming that smart meter installation effects remained consistently non-significant across all specifications.
About the study
Participants
1,209,835 monthly electricity observations and 1,216,499 monthly gas observations from British Gas households in the United Kingdom.
Study Design
Sensitivity analysis testing treatment effects across six econometric specifications combining top/bottom 1% trimming, top/bottom 5% trimming, and 2 standard deviation exclusion filters.
Results
Electricity mean usage changed from 295.91 kWh (SD 169.05) under 1% trimming to 283.93 kWh (SD 127.90) under 5% trimming; gas mean usage changed from 1207.05 kWh (SD 1031.30) under 1% trimming to 1125.38 kWh (SD 824.25) under 5% trimming, while post-installation treatment effects remained statistically non-significant in all specifications.