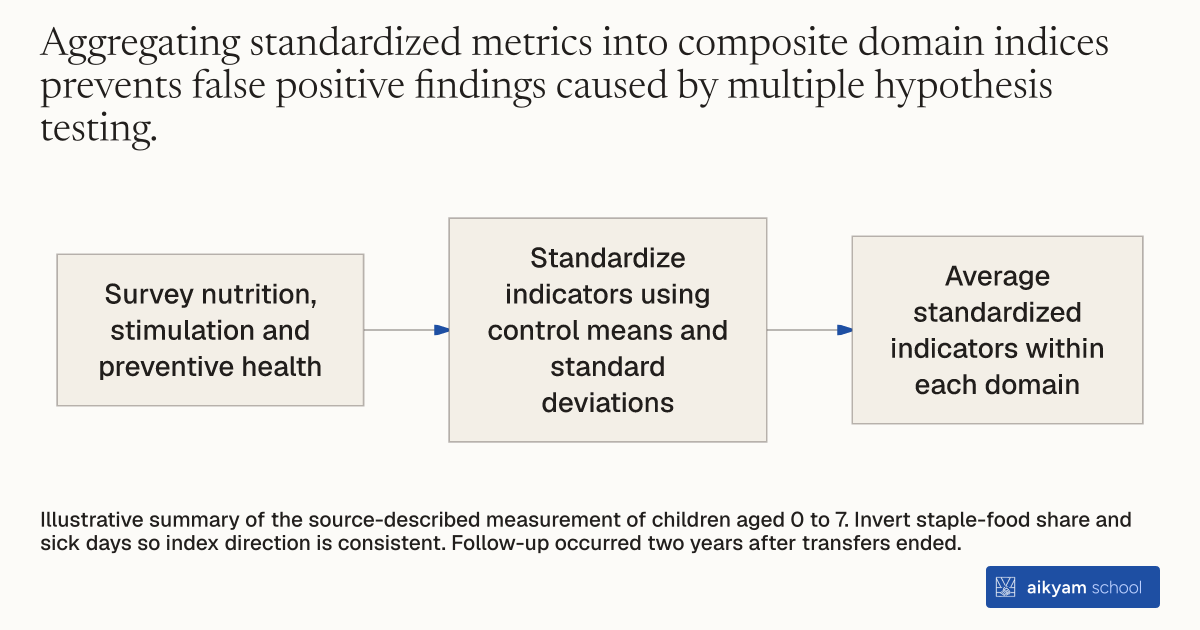
Research procedure
Combine early childhood investment indicators
- Survey nutrition, stimulation and preventive health
- Standardize indicators using control means and standard deviations
- Average standardized indicators within each domain
Illustrative summary of the source-described measurement of children aged 0 to 7. Invert staple-food share and sick days so index direction is consistent. Follow-up occurred two years after transfers ended.
See source →How
When to use
Social protection interventions seek to evaluate long-term developmental impacts on young children across multiple diverse practices. Individual indicator analysis can increase false discovery risks and miss overall parental behavioral shifts. Apply this evaluation method for households with children aged zero to seven years old.
Construct composite z-score indices across nutrition, stimulation, and health indicators to measure early childhood investments.
- Collect survey data on household nutrition, cognitive stimulation, and preventative health practices for children under eight years old.
- Define the nutrition index by averaging z-scores for food expenditure share, animal protein share, fruit and vegetable share, and the inverted staple food share.
- Define the cognitive stimulation index by averaging z-scores for household pen and paper presence, toy ownership, story-telling or singing, and weekly reading hours.
- Define the preventative health index by averaging z-scores for child growth weighing, vitamin or iron supplementation, deworming medication, and inverse sick days in bed.
- Standardize each individual indicator by subtracting the control group mean and dividing by the control group standard deviation.
- Calculate final composite outcome z-scores by averaging standardized indicators within each outcome domain.
Why it works
Domain-level z-scores capture systematic, multi-dimensional shifts in parental caregiving and human capital investments.
Example
In 2008, survey teams evaluated early childhood investments across three thousand four hundred ten children aged zero to seven in six municipalities of northwestern Nicaragua two years after cash transfers ended.
About the study
Participants
3,410 children aged 0 to 7 years old (and a subgroup of 660 children aged 0 to 2 years old born after transfers ended) in 106 rural communities across 6 municipalities in northwestern Nicaragua.
Study Design
Follow-up survey measuring standardized domain z-scores two years post-intervention, comparing households with varying exposure to successful leaders against control households.
Results
Full exposure to leaders with the largest package significantly increased early childhood nutrition z-scores by 0.323 standard deviations and stimulation z-scores by 0.143 standard deviations among children aged 0 to 7 years old.