Research procedure
Estimate teacher contributions to learning
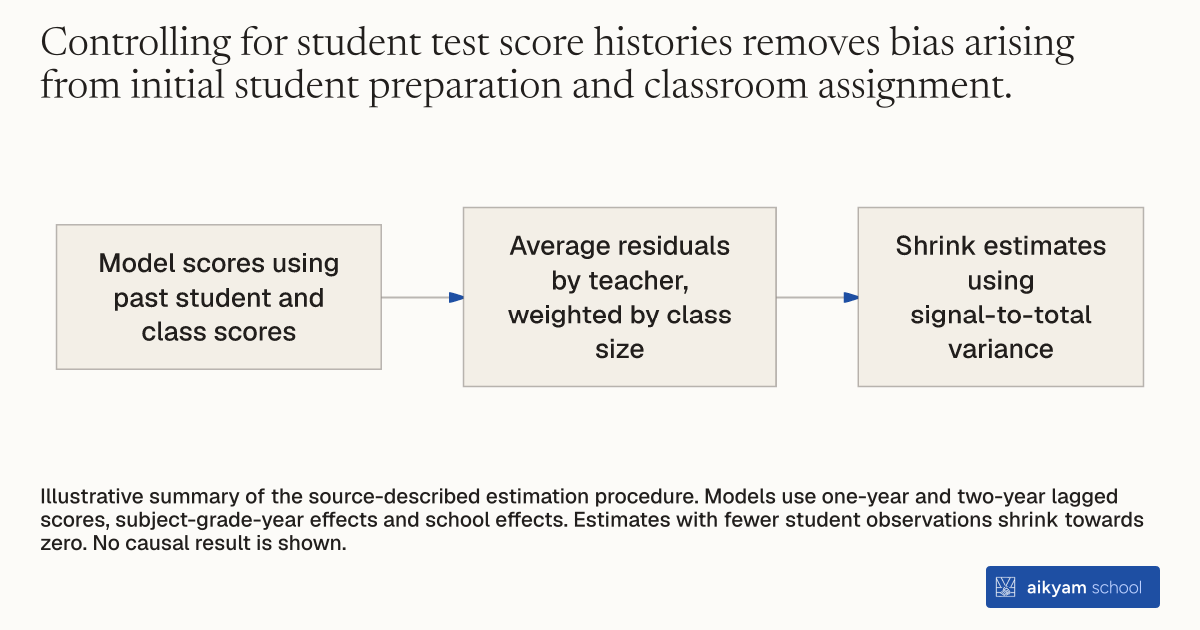
- Model scores using past student and class scores
- Average residuals by teacher, weighted by class size
- Shrink estimates using signal-to-total variance
Illustrative summary of the source-described estimation procedure. Models use one-year and two-year lagged scores, subject-grade-year effects and school effects. Estimates with fewer student observations shrink towards zero. No causal result is shown.
See source →How
When to use
Schools struggle to isolate true teacher contributions to student learning from baseline preparation, classroom composition, and sample noise. Raw test score gains penalize teachers in lower-performing classrooms and skew evaluations in small samples. This method provides educational systems with an unbiased, variance-adjusted measure of underlying teacher productivity.
Estimate teacher value-added using lagged student achievement records and empirical Bayes shrinkage to isolate teacher effects from classroom and statistical noise.
- Regress student test scores on one-year and two-year lagged individual subject test scores and class average lagged scores, allowing coefficients to vary across subject-grades.
- Include subject-grade-year fixed effects and school-specific fixed effects to control for system-wide and location-specific shocks.
- Extract student-level residuals containing teacher effects, classroom effects, and student-time specific shocks.
- Calculate each teacher's class-size-weighted average residual across observed classes and academic years.
- Multiply average residuals by a shrinkage factor based on the ratio of signal variance to total variance, shrinking estimates for teachers with fewer student observations toward the zero mean.
Why it works
Shrinking estimated teacher effects by their signal-to-noise ratio prevents random sampling variability from overstating productivity in small classrooms.
Example
Researchers evaluated 3,687 teachers across three baseline school years in a Pakistani private school network, observing an average of 181 students across 5.6 classrooms per teacher. Having a teacher with 1 standard deviation higher estimated value-added increased student test scores by 0.15 standard deviations over one school year.
About the study
Participants
3,687 teachers across 300 private schools in Pakistan, linked to administrative test scores from 50,000 students in grades 4 through 13.
Study Design
Econometric evaluation specification following Kane and Staiger (2008), combining 3 years of pre-intervention administrative exam records with class-size weighting and empirical Bayes shrinkage.
Results
A 1 standard deviation increase in empirical Bayes value-added yielded 0.15 standard deviations higher student test scores, and baseline value-added predicted a 0.047 standard deviation difference in contract choice and a 0.022 standard deviation positive sorting shift across schools after one year.