Research procedure
Compare trimmed and full-sample models
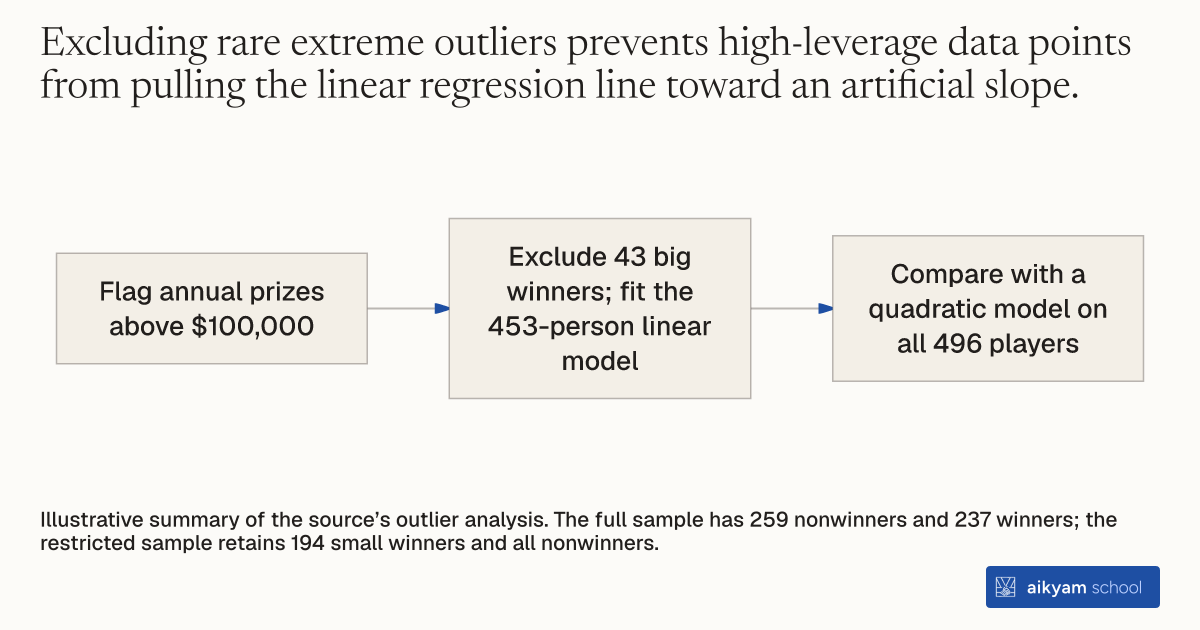
- Flag annual prizes above $100,000
- Exclude 43 big winners; fit the 453-person linear model
- Compare with a quadratic model on all 496 players
Illustrative summary of the source’s outlier analysis. The full sample has 259 nonwinners and 237 winners; the restricted sample retains 194 small winners and all nonwinners.
See source →How
When to use
Researchers evaluate dataset interventions where a small number of extreme high-value outliers skew statistical estimates. Linear regressions across heavily skewed payments allow rare giant observations to dominate parameter fits. Trimming extreme upper-tail outliers recovers stable baseline parameter estimates for typical population subjects.
Exclude extreme upper-tail prize winners from linear regressions to prevent rare multi-million dollar payouts from distorting parameter fits.
- Identify the upper cutoff threshold for annual unearned income transfers at 100,000 dollars per year.
- Flag all survey observations receiving annual prizes above 100,000 dollars as extreme big winner outliers.
- Remove the flagged extreme outlier observations from the primary analytical estimation sample.
- Estimate linear regressions of labor earnings, savings, and consumption on annual prize payments using the remaining restricted subsample.
- Compare the resulting parameter estimates against non-linear quadratic models fitted on the full dataset to confirm parameter stability.
Why it works
This allows linear models to capture accurate behavioral responses among typical program recipients without requiring polynomial transformations.
Example
Researchers evaluated 496 Massachusetts lottery players and identified 43 big winners receiving over 100,000 dollars yearly. Trimming these 43 extreme big winners reduced the average yearly prize among winners from 55,200 dollars to 31,500 dollars and shifted the estimated marginal propensity to earn from -0.051 in the full sample to -0.122 in the trimmed subsample.
About the study
Participants
453 lottery players (259 nonwinners and 194 small winners receiving under 100,000 dollars per year) in Massachusetts.
Study Design
Subsample trimming OLS panel regression excluding 43 big winners (annual prizes exceeding 100,000 dollars) while controlling for baseline demographic and historical earnings covariates.
Results
Excluding big winners increased the estimated labor earnings response from -0.051 (standard error 0.014) in the full linear sample to -0.122 (standard error 0.020) in the trimmed sample, aligning closely with full-sample quadratic estimates (-0.114).