Research procedure
Compare earnings changes with prize income
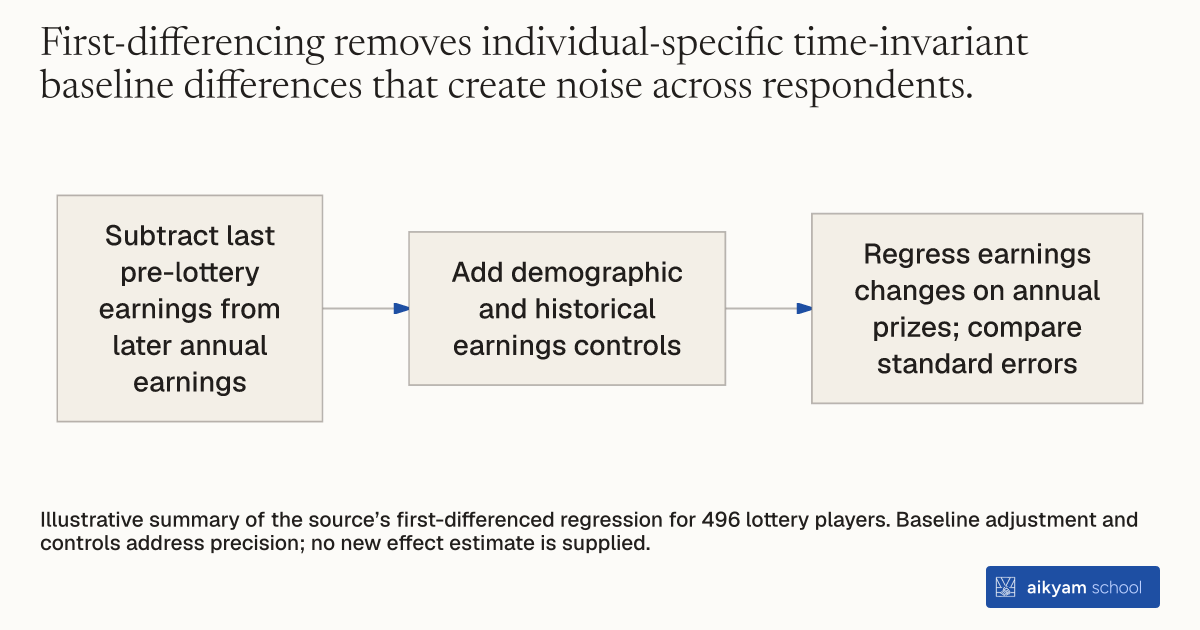
- Subtract last pre-lottery earnings from later annual earnings
- Add demographic and historical earnings controls
- Regress earnings changes on annual prizes; compare standard errors
Illustrative summary of the source’s first-differenced regression for 496 lottery players. Baseline adjustment and controls address precision; no new effect estimate is supplied.
See source →How
When to use
Researchers face estimation noise when evaluating policy interventions in longitudinal panel datasets. Unobserved baseline differences across survey respondents introduce variation into outcome measures over time. Subtracting pre-treatment baseline values from post-treatment outcomes while controlling for historical covariates reduces residual variance and improves parameter precision.
First-difference post-treatment outcome variables against baseline pre-treatment values and include individual demographic and historical earnings controls in linear regressions.
- Subtract each subject's baseline earnings recorded in the last pre-treatment year from their post-treatment annual earnings.
- Select a basic set of demographic controls including education years, age, gender, and college attendance indicators.
- Expand the covariate set by adding pre-lottery ticket purchases, winning year, and individual dummy variables for positive earnings across six pre-treatment years.
- Regress the differenced post-lottery annual earnings on yearly treatment prize amounts alongside the full set of baseline covariates.
- Compare parameter standard errors across specifications to verify precision gains.
Why it works
Adding baseline covariates that correlate strongly with post-treatment outcomes reduces residual variance and lowers standard errors without biasing treatment estimates.
Example
Researchers estimated unearned income effects across 496 lottery players by subtracting last pre-lottery earnings from post-lottery earnings. Including the expanded set of baseline earnings covariates reduced the standard error of the estimated labor supply response from 0.013 in the unadjusted model to 0.008 in the differenced model with controls.
About the study
Participants
496 lottery players (259 nonwinners and 237 winners) in Massachusetts with complete pre-lottery records.
Study Design
OLS panel regression comparing un-differenced earnings models against first-differenced earnings models (subtracting year -1 earnings) with an expanded set of 21 baseline demographic and historical earnings covariates.
Results
First-differencing combined with baseline controls produced a marginal propensity to earn estimate of -0.051 (standard error 0.008) in the full sample, reducing parameter standard error by 38 percent compared to the unadjusted linear model (standard error 0.013).