Research steps
Measure how fertilizer use clusters by village
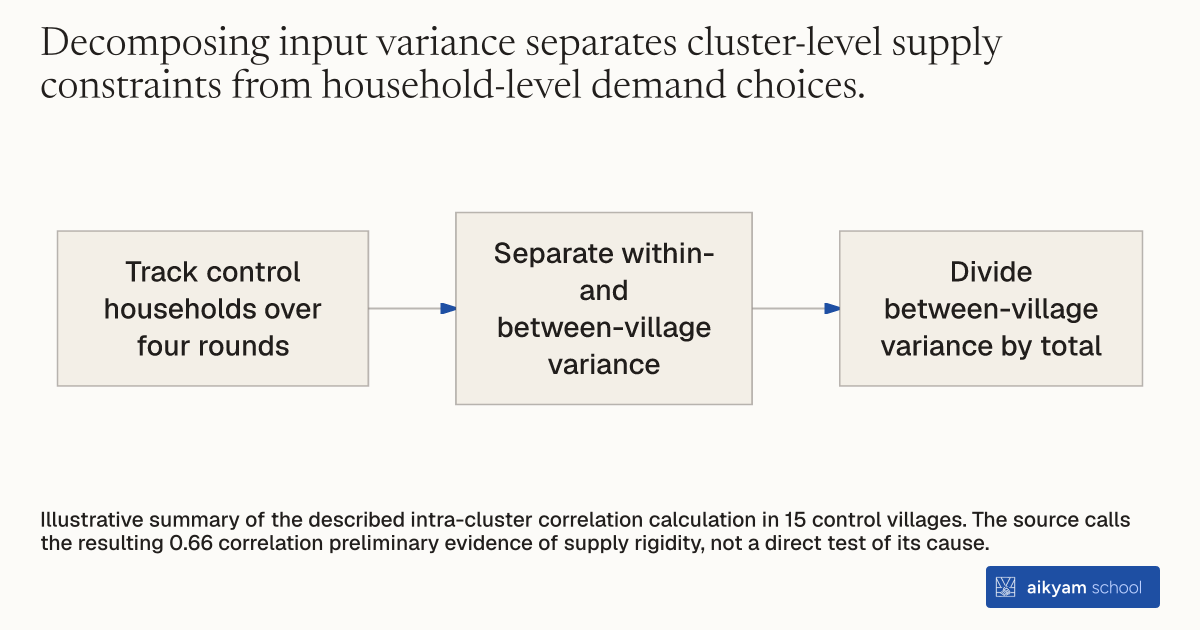
- Track control households over four rounds
- Separate within- and between-village variance
- Divide between-village variance by total
Illustrative summary of the described intra-cluster correlation calculation in 15 control villages. The source calls the resulting 0.66 correlation preliminary evidence of supply rigidity, not a direct test of its cause.
See source →How
When to use
Centralized state-led input supply chains often constrain individual smallholder purchasing choices in developing regions. Evaluating the extent to which village-level procurement systems restrict household input decisions helps researchers measure structural supply chain rigidity. This method identifies whether agricultural input adoption is driven by individual farmer choices or centralized village allocation.
Measure structural input supply rigidity by calculating the intra-cluster correlation of household chemical fertilizer use across panel survey waves.
- Collect panel survey data on seasonal household chemical fertilizer usage across control group villages over multiple agricultural waves.
- Structure the dataset to nest individual household fertilizer observations within village cluster units across survey rounds.
- Estimate a random-intercept variance components model decomposing total fertilizer variance into between-village and within-village variance components.
- Calculate the intra-cluster correlation coefficient by dividing between-village variance by total variance across control group observations.
- Evaluate the proportion of variance fixed at the village procurement level relative to individual farmer decision-making.
- Use high intra-cluster correlation values to diagnose state or cooperative supply chain bottlenecks that restrict individual input adjustments.
Why it works
High intra-cluster correlation confirms that centralized ordering schedules and village-level quota allocations restrict individual farmer flexibility despite risk protection interventions.
Example
Researchers calculated the intra-cluster correlation for chemical fertilizer use across control group villages in Amhara, Ethiopia, finding a value of 0.66 across four survey rounds.
About the study
Participants
Control group households across 15 panel study villages in Amhara Region, Ethiopia, tracked over 4 survey rounds.
Study Design
Variance decomposition and intra-cluster correlation estimation of chemical fertilizer use across control group panel observations across four survey rounds.
Results
Estimated an intra-cluster correlation of 0.66 for chemical fertilizer use in the control group across four survey rounds, demonstrating that two-thirds of input variation is fixed at the village level and only one-third exists within-village.