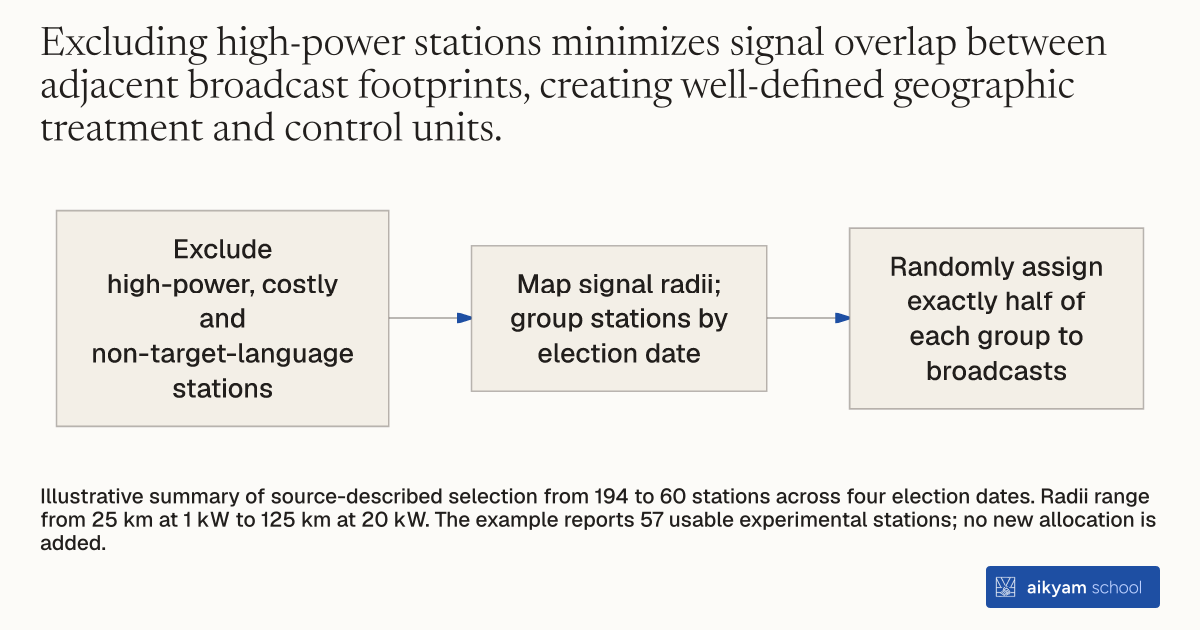
Research steps
Select stations before random assignment
- Exclude high-power, costly and non-target-language stations
- Map signal radii; group stations by election date
- Randomly assign exactly half of each group to broadcasts
Illustrative summary of source-described selection from 194 to 60 stations across four election dates. Radii range from 25 km at 1 kW to 125 km at 20 kW. The example reports 57 usable experimental stations; no new allocation is added.
See source →How
When to use
High-power media transmitters cause overlapping coverage areas across adjacent geographic regions, making cluster randomization difficult in field experiments. Evaluators testing mass media interventions need distinct spatial units with minimal signal spillovers. Selecting low-power public radio stations eliminates high-power overlap and budget-prohibitive stations to establish well-defined randomized treatment and control areas.
Select low-power public radio stations to define localized geographic clusters for randomized media evaluation.
- Compile a national list of public radio stations operating across the target study region.
- Exclude high-power transmitter stations whose large broadcast footprints overlap with neighboring stations.
- Exclude stations with prohibitively high advertising rates to remain within research budget constraints.
- Restrict the sample to stations broadcasting in major widely understood regional languages.
- Determine coverage radii around each station based on transmitter power ratings, ranging from 25 kilometers for 1 kW transmitters to 125 kilometers for 20 kW transmitters.
- Group stations by election phase dates and randomly assign exactly half in each group to broadcast the intervention.
Why it works
This clear spatial separation allows researchers to estimate direct persuasion effects using inverse-probability weights and multi-way spatial clustering.
Example
Researchers selected 60 low-power All India Radio stations out of 194 candidate stations across 10 Indian states during the 2014 general elections. Dropping 57 high-power stations, 30 high-cost stations, and 47 non-target language stations yielded 57 usable experimental stations covering 615 assembly constituencies, with 312 constituencies assigned to treatment and 303 to control.
About the study
Participants
The study covered 615 assembly constituencies across 10 Indian states representing 67 percent of the national population, with 312 treatment constituencies and 303 control constituencies. Residents across sample constituencies were 79.15 percent rural, 59.52 percent literate, and 31.77 percent Scheduled Caste or Scheduled Tribe.
Study Design
Researchers screened 194 All India Radio stations, dropping 57 high-power, 30 high-cost, and 47 non-target language stations to select 60 low-power stations grouped across 4 election dates. Exactly half of the stations in each group were randomly assigned to broadcast 48 radio ad airings over a 3-day pre-election window, analyzed using inverse-probability weighted least squares with multi-way clustering.
Results
Station selection established 570 assembly constituencies with a 0.5 treatment probability, 44 with 0.75, and 1 with 0.875, achieving baseline covariate balance across treatment and control groups (joint F-statistic p-value = 0.33). The resulting RCT detected a 3.5 to 7.1 percentage point reduction in vote share for vote-buying parties.