Research steps
Match survey respondents by propensity score
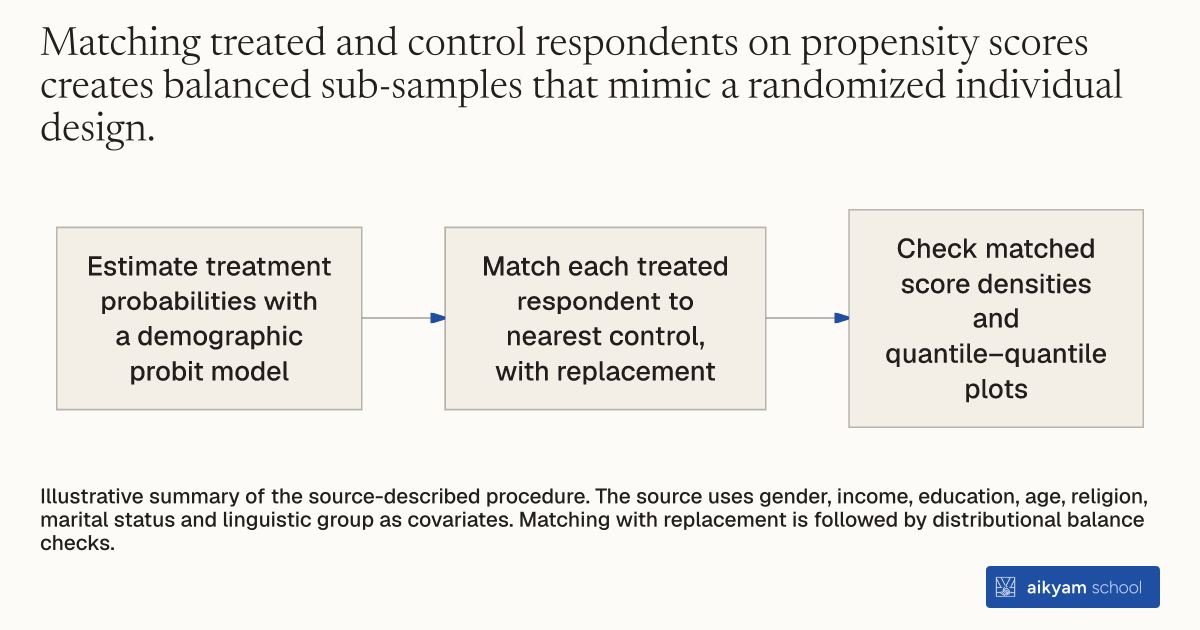
- Estimate treatment probabilities with a demographic probit model
- Match each treated respondent to nearest control, with replacement
- Check matched score densities and quantile–quantile plots
Illustrative summary of the source-described procedure. The source uses gender, income, education, age, religion, marital status and linguistic group as covariates. Matching with replacement is followed by distributional balance checks.
See source →How
When to use
Researchers evaluate survey respondents across treated and control communities where individual assignment was not directly randomized. Potential imbalances in individual sociodemographic characteristics between treatment and control areas can introduce model dependency into post-election survey comparisons. Matching treated and control individuals on estimated propensity scores pre-processes survey data to ensure comparable covariate distributions.
Pre-process individual survey data by matching treated and control respondents on estimated propensity scores using a nearest-neighbor technique with replacement.
- Specify key demographic covariates from the survey questionnaire, including gender, household income, education level, age bracket, religion, marital status, and linguistic group.
- Estimate individual probabilities of treatment assignment using a probit regression model conditioned on the specified sociodemographic covariates.
- Compute the predicted propensity score for each survey respondent in treatment and control communities.
- Match each respondent in the treatment group to the nearest control respondent based on absolute propensity score distance, allowing matching with replacement.
- Verify balance across matched samples by comparing empirical quantile-quantile distributions and verifying that matched treatment and control propensity score densities align.
Why it works
Aligning propensity score distributions between groups reduces reliance on parametric model assumptions when estimating causal treatment effects.
Example
In a post-election survey of 1,082 citizens following the May 2013 election in the Philippines, researchers evaluated potential sociodemographic imbalances between treatment and control barangays. They estimated propensity scores using a probit model on age, gender, income, education, religion, marital status, and linguistic group, and executed nearest-neighbor matching with replacement. Quantile-quantile plots confirmed that matched treatment and control distributions aligned across propensity score ranges, verifying covariate balance across survey respondents.
About the study
Participants
1,030 post-election survey respondents across treatment and control barangays in Metro Manila and Calabarzon, Philippines.
Study Design
Nearest-neighbor propensity score matching with replacement using probit model estimation across 8 sociodemographic covariates to test pre-treatment covariate balance across survey units.
Results
Propensity score matching confirmed strong covariate balance between treatment and control survey respondents, showing near-zero mean differences across matched covariates and verifying that survey imbalance did not distort treatment effect estimates.