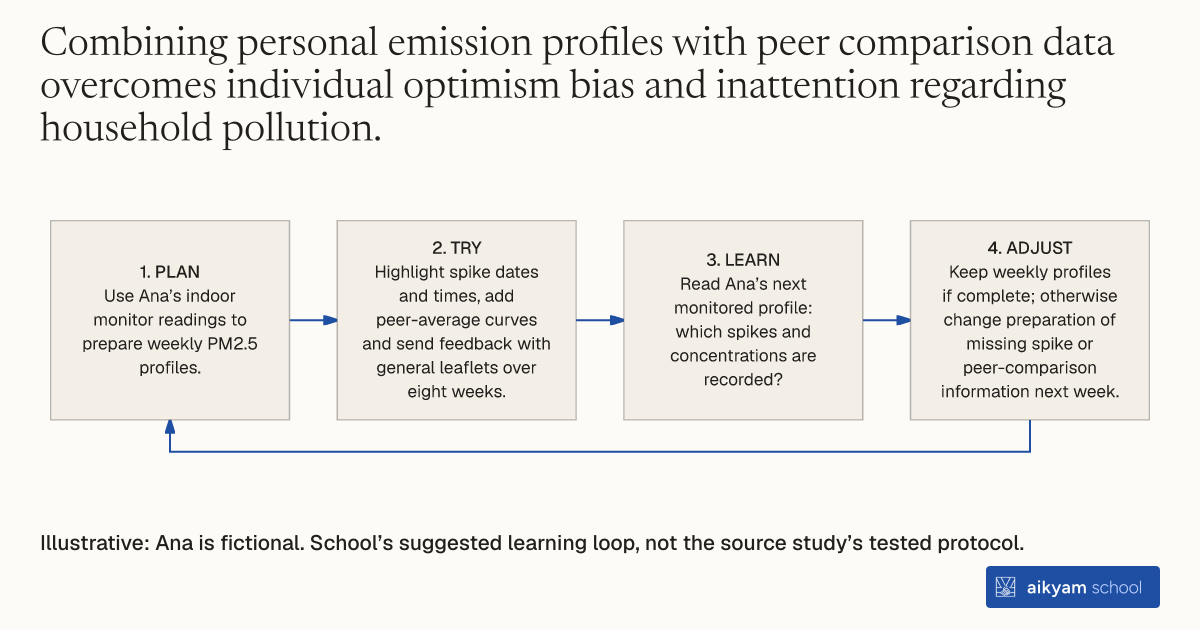
Try, learn and adjust
Check weekly feedback shows household pollution spikes
- Plan: Use Ana’s indoor monitor readings to prepare weekly PM2.5 profiles.
- Try: Highlight spike dates and times, add peer-average curves and send feedback with general leaflets over eight weeks.
- Learn: Read Ana’s next monitored profile: which spikes and concentrations are recorded?
- Adjust: Keep weekly profiles if complete; otherwise change preparation of missing spike or peer-comparison information next week.
Illustrative: Ana is fictional. School’s suggested learning loop, not the source study’s tested protocol.
See source →School’s suggested, untested learning loop. Observe PM2.5 profiles and feedback completeness; this suggested loop does not itself establish pollution reductions.
How
When to use
Households consistently overestimate their indoor air quality and fail to recognize pollution spikes caused by residential heating. Generic public health leaflets fail to trigger individual behavioral adjustments because residents assume warnings apply to others. Providing personalized emission feedback alongside peer benchmark comparisons forces households to recognize their own contribution to indoor particulate pollution.
Deliver personalized indoor air quality feedback coupled with social comparison benchmarks to wood-heating households.
- Collect continuous indoor PM2.5 emissions data from monitors installed inside target residences.
- Generate weekly personal emission profiles illustrating PM2.5 concentration levels over time.
- Highlight specific dates and times when indoor pollution levels spiked.
- Plot individual household emission curves alongside average air quality readings from peer comparison households.
- Deliver personalized weekly feedback sheets to participants alongside general educational leaflets between January and March.
Why it works
Seeing highlighted emission spikes alongside peer benchmarks prompts households to alter daily combustion habits and mitigate indoor particulate accumulation.
Example
Researchers provided 93 wood-heating households in France with weekly personalized PM2.5 feedback alongside peer comparisons over four months. Indoor PM2.5 concentrations dropped by 1.3 µg/m³ (24 percent) and days exceeding the WHO 25 µg/m³ threshold decreased by 1.44 days (50 percent) relative to the comparison group.
About the study
Participants
93 wood-heating households in France receiving personalized PM2.5 feedback, evaluated against 94 comparison households.
Study Design
Randomized controlled trial delivering 8 weekly personalized emission sheets showing individual PM2.5 timelines, highlighted pollution spikes, and peer group averages from January to March 2020.
Results
PM2.5 concentrations decreased by 1.3 µg/m³ (24 percent) and WHO threshold exceedance days decreased by 1.44 days (50 percent) in the personalized information group relative to comparison households.