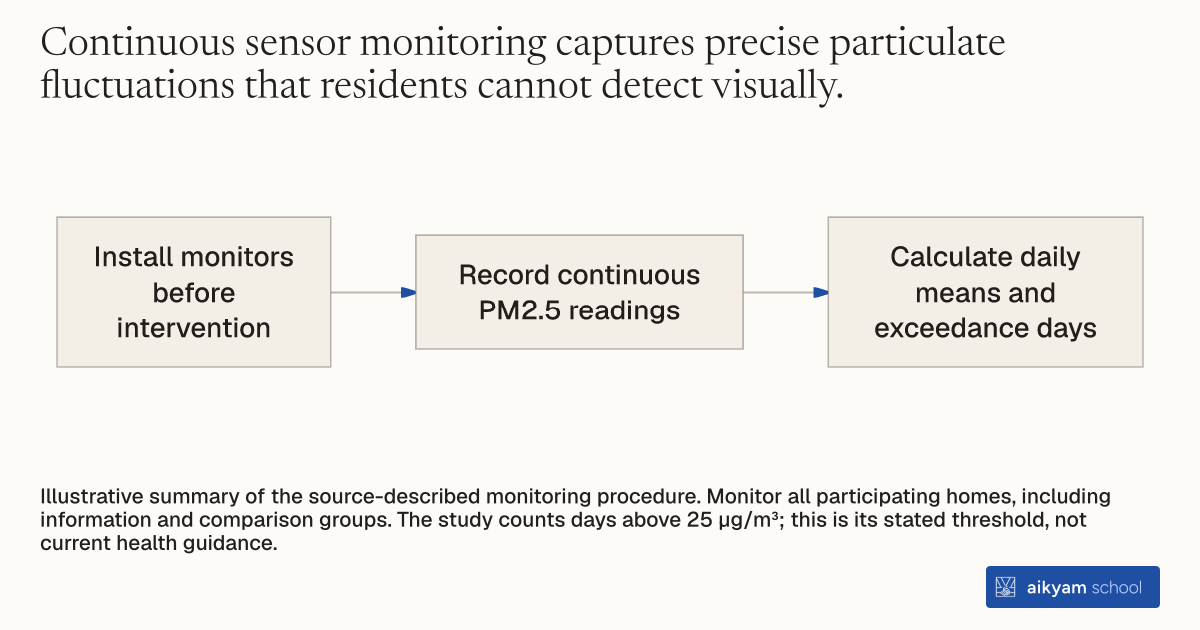
Research steps
Track indoor fine particles
- Install monitors before intervention
- Record continuous PM2.5 readings
- Calculate daily means and exceedance days
Illustrative summary of the source-described monitoring procedure. Monitor all participating homes, including information and comparison groups. The study counts days above 25 µg/m³; this is its stated threshold, not current health guidance.
See source →How
When to use
Households often overestimate their indoor air quality because fine particulate pollution is invisible. Measuring indoor air pollution requires objective, automated tracking rather than self-reported habits. Installing indoor air sensors provides continuous baseline and post-intervention fine particulate data for environmental health interventions.
Install continuous indoor air quality sensors to collect long-term particulate matter readings across participating households.
- Place an air quality monitor inside each participating home prior to starting interventions.
- Record continuous indoor PM2.5 concentrations over a multi-month evaluation period.
- Track daily mean PM2.5 pollution levels across intervention and comparison groups.
- Compare daily readings against World Health Organization safety guidelines of 25 µg/m³.
- Calculate threshold exceedance days to measure acute pollution spikes in each household.
Why it works
This creates an objective dataset for evaluating environmental interventions and generating household feedback.
Example
Researchers placed air quality monitors in 281 French homes to track indoor PM2.5 concentrations over four months. Monitored data revealed baseline pollution levels and measured changes in daily emissions across experimental groups.
About the study
Participants
N = 281 eligible wood-heating households in France across comparison (94), general information (93), and personalized information (93) groups.
Study Design
Continuous indoor PM2.5 sensor monitoring across all households from January to March 2020, evaluating daily mean pollution levels and WHO guideline threshold exceedances.
Results
Sensors captured a 1.3 µg/m³ (24%) decrease in indoor PM2.5 and a 1.44 day (50%) reduction in days exceeding WHO 25 µg/m³ limits in the personalized information group relative to the comparison group.