Research steps
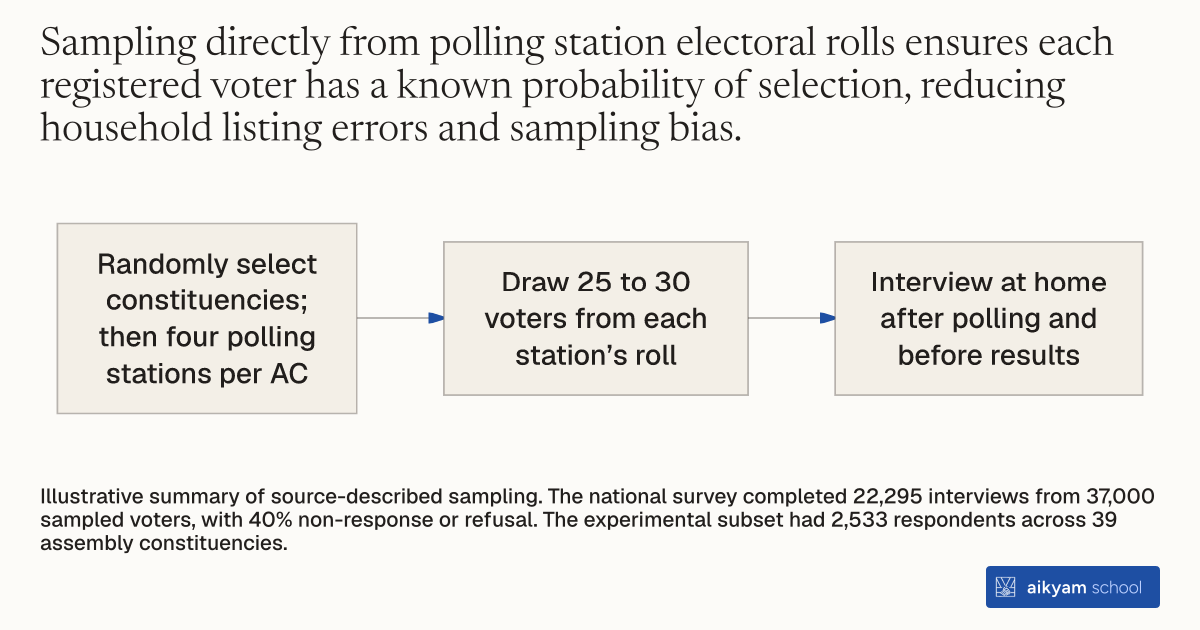
Draw voters from electoral rolls
- Randomly select constituencies; then four polling stations per AC
- Draw 25 to 30 voters from each station’s roll
- Interview at home after polling and before results
Illustrative summary of source-described sampling. The national survey completed 22,295 interviews from 37,000 sampled voters, with 40% non-response or refusal. The experimental subset had 2,533 respondents across 39 assembly constituencies.
See source →How
When to use
In election studies, measuring individual voter attitudes and corrupt practices requires a representative sample of citizens drawn directly from official records. Self-reported surveys without standardized geographic sampling risk selection bias and unrepresentative respondent pools. Researchers can draw multi-stage random samples directly from polling station electoral rolls to measure voter attitudes and electoral experiences.
Select a representative voter sample by drawing a multi-stage cluster sample from official polling station voter rolls across target assembly constituencies.
- Select a random sample of parliamentary constituencies and assembly constituencies across target study regions.
- Randomly select 4 polling stations within each sampled assembly constituency.
- Draw a systematic sample of 25 to 30 registered voters directly from the official electoral rolls of each selected polling station.
- Conduct face-to-face interviews with selected voters in their homes after polling concludes but before election results are announced.
- Administer a standardized questionnaire covering vote choice, issue salience, candidate gift offers, and exposure to party campaigning.
Why it works
Post-poll interviews conducted before result announcements capture genuine voter attitudes and observed malpractices without hindsight bias.
Example
Researchers evaluated a national post-poll survey conducted by the Centre for the Study of Developing Societies across 347 assembly constituencies during the 2014 Indian general elections. Surveyors interviewed 22,295 registered voters drawn from electoral rolls across four polling stations per constituency, capturing data for 2,533 respondents across 39 experimental assembly constituencies.
About the study
Participants
The CSDS national voter study drew a sample of 37,000 registered voters across 347 assembly constituencies and 306 parliamentary constituencies, completing interviews with 22,295 respondents (a 40 percent non-response/refusal rate). The sub-sample covering 39 experimental assembly constituencies comprised 2,533 respondents who were 48 percent female, 77 percent rural, 29 percent non-literate, 19 percent Scheduled Caste, and 15 percent Scheduled Tribe.
Study Design
Researchers used a multi-stage stratified random sampling design selecting 4 polling stations per assembly constituency and 25 to 30 voters per polling station roll, conducting face-to-face interviews after polling but before election result releases. Respondent survey data were merged with the 60-station radio RCT using multi-way clustered standard errors by radio station footprint.
Results
The survey revealed that the radio campaign increased the salience of government corruption as the top election issue by 8 percentage points (p = 0.05) and reduced the probability of voting for gift-offering parties by 8 percentage points (p = 0.12). Observed party home visits (72 percent) and gift distribution (23 percent) showed no significant differences between treatment and control areas.