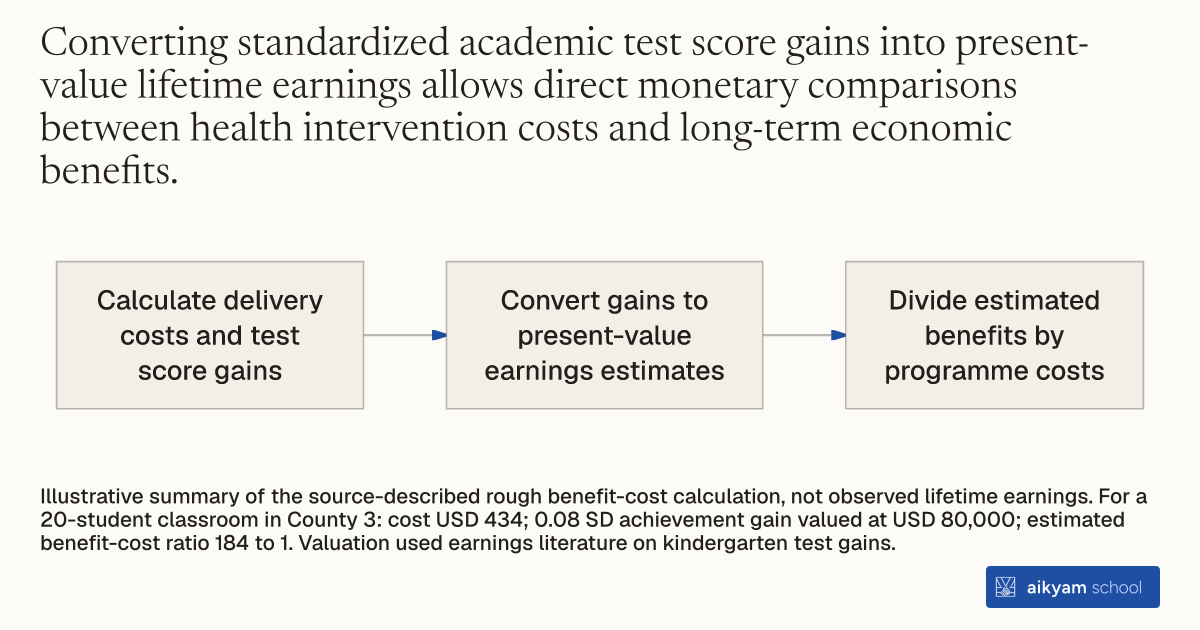
Research steps
Estimate benefits relative to vision care costs
- Calculate delivery costs and test score gains
- Convert gains to present-value earnings estimates
- Divide estimated benefits by programme costs
Illustrative summary of the source-described rough benefit-cost calculation, not observed lifetime earnings. For a 20-student classroom in County 3: cost USD 434; 0.08 SD achievement gain valued at USD 80,000; estimated benefit-cost ratio 184 to 1. Valuation used earnings literature on kindergarten test gains.
See source →How
When to use
School districts and educational policymakers need to determine whether non-academic health interventions justify their financial costs relative to academic benefits. Standard health programs often lack quantitative economic valuations linking test score gains to future lifetime economic returns. Estimating benefit-cost ratios using net present value conversion methods establishes the financial return of providing vision care in elementary schools.
Estimate the economic return of a school health intervention by translating observed test score gains into future economic benefits relative to program delivery costs.
- Calculate the per-student and per-classroom operational costs of screening, comprehensive exams, and eyeglasses delivery using provider financial data.
- Obtain average student achievement gains in standard deviation units from randomized impact evaluations across subjects and grades.
- Multiply the standard deviation test gains by established present-value earnings estimates to quantify total lifetime benefits per classroom.
- Divide total quantified lifetime economic benefits per classroom by the total classroom program delivery cost to derive the benefit-cost ratio.
Why it works
This provides clear economic evidence for allocating education budgets toward high-return health programs.
Example
In County 3 Title 1 elementary schools, Florida Vision Quest delivered vision screenings and free eyeglasses at a total cost of \$434 per classroom, which produced average achievement gains of 0.08 standard deviations valued at \$80,000 in net present value per class, yielding a benefit-cost ratio of 184 to 1.
About the study
Participants
5,979 fourth and fifth grade Title 1 elementary school students in County 3, central Florida, where 89% qualified for free or reduced-price lunch.
Study Design
Back-of-the-envelope cost-benefit analysis comparing mobile vision service costs (\$2 per screening, \$100 per exam and eyeglasses pair) against net present value earnings literature for kindergarten test score gains.
Results
Providing vision screening and free eyeglasses cost \$434 per classroom of 20 students and generated \$80,000 in social net present value benefits, producing a benefit-cost ratio of 184 to 1.