Research procedure
Measure alignment of preference rankings
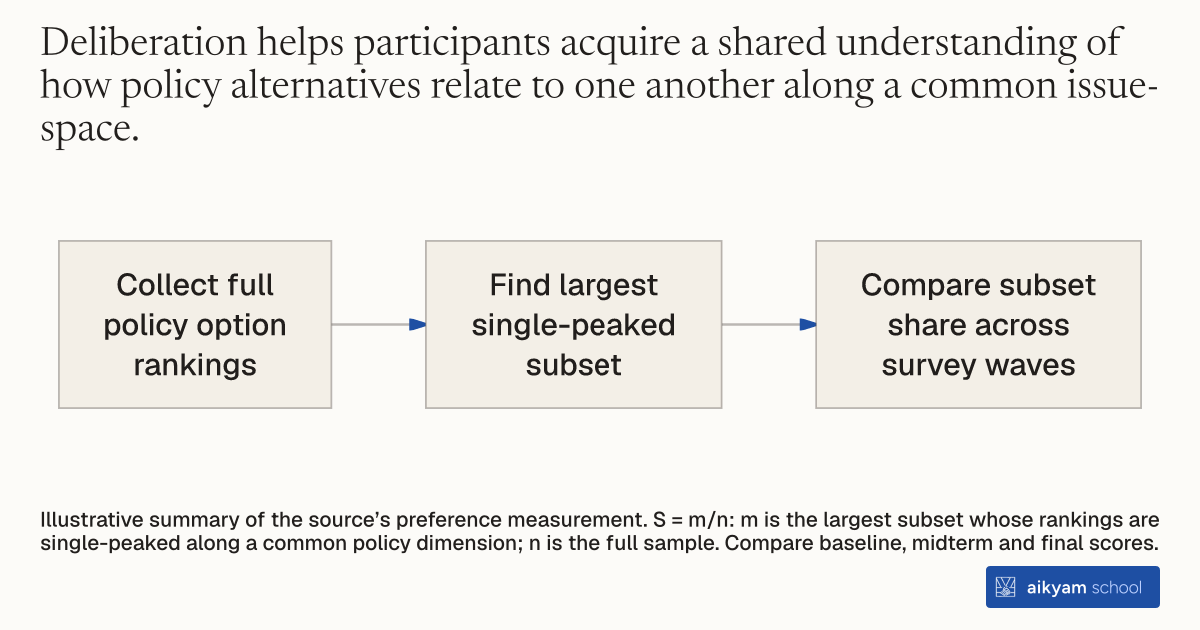
- Collect full policy option rankings
- Find largest single-peaked subset
- Compare subset share across survey waves
Illustrative summary of the source’s preference measurement. S = m/n: m is the largest subset whose rankings are single-peaked along a common policy dimension; n is the full sample. Compare baseline, midterm and final scores.
See source →How
When to use
Group decision-making processes risk cyclical majorities where no single policy alternative beats all others in pairwise voting. Analysts use this method to measure how deliberation structures public preferences and reduces voting paradoxes. It allows evaluators to determine whether public discussion helps build meta-level agreement on underlying policy dimensions.
Calculate the proportion of survey respondents whose full ordinal option rankings align along a single underlying policy dimension.
- Ask respondents to rank all available policy options from most preferred to least preferred in questionnaires.
- Identify a single dimension that orders the policy options along an underlying spectrum.
- Count the number of respondents whose complete preference rankings are single-peaked along that dimension.
- Calculate the proximity index S by dividing the largest subset of single-peaked respondents by the total sample size.
- Compare proximity index scores across baseline, midterm, and final surveys to evaluate structural preference changes over time.
Why it works
As citizens discuss and learn about competing options, their preferences align more consistently along a single dimension, reducing majority cycles and ensuring a stable Condorcet winner.
Example
Researchers measured preference proximity among 132 participants ranking revenue-sharing options across a weekend deliberative event in New Haven, Connecticut. Over the course of the event, the proximity index for revenue sharing increased dramatically from 0.52 at baseline to 0.80 at event completion, shifting the Condorcet winner from state-encouraged sharing to voluntary sharing.
About the study
Participants
Initial interview sample of 1,032 residents from 15 towns surrounding New Haven, Connecticut, with 133 attending the event and 132 completing questionnaires. Participants were 50.8% male, 49.2% female, 72.7% Caucasian, 12.1% African American, 3% Hispanic or Latino/a, and 90.2% registered voters, with an average age of 50.1 years.
Study Design
Randomized field experiment within a split-half Deliberative Poll where ordinal rankings gathered across three waves (T1, T2, T3) were used to calculate proximity to single-peakedness (S = m/n) with bootstrapped standard errors across two treatment streams.
Results
On revenue sharing, proximity to single-peakedness increased from 0.52 at T1 to 0.70 at T2 and 0.80 at T3 for the overall sample. In the revenue-sharing-first stream, proximity rose from 0.47 at T1 to 0.78 at T2 during on-site deliberation, whereas in the airport-first stream, proximity rose from 0.56 at T1 to 0.63 at T2 and then to 0.84 at T3 after deliberating revenue sharing. On airport service, overall proximity moved modestly from 0.77 at T1 to 0.84 at T2 and 0.81 at T3.