Research procedure
Allow a curved prize-response relationship
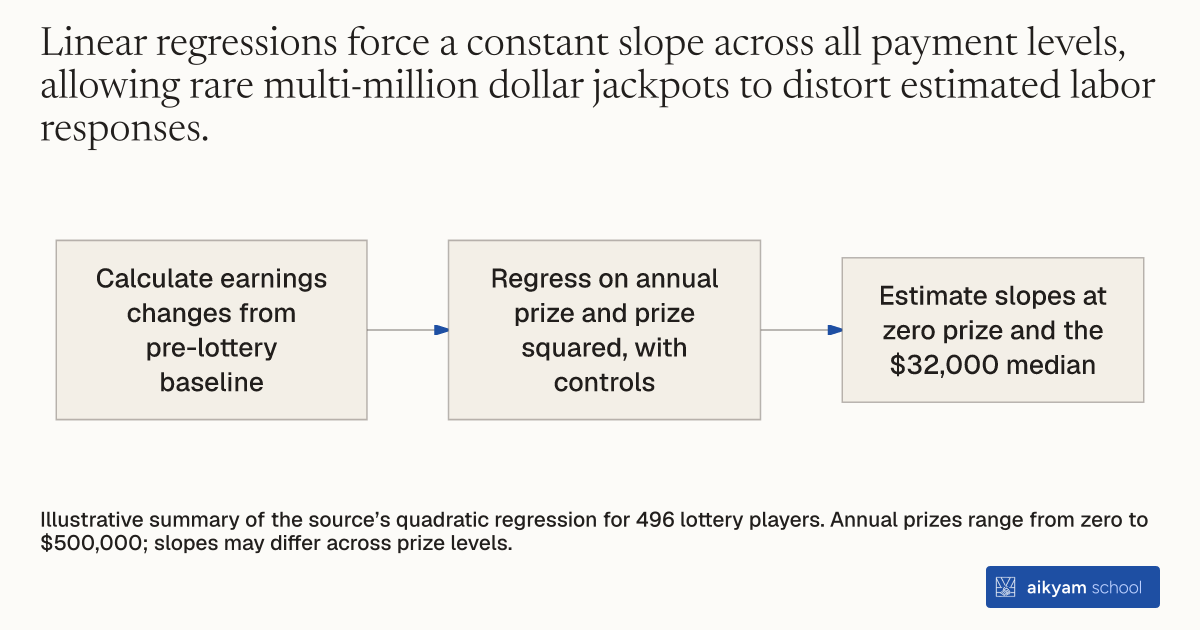
- Calculate earnings changes from pre-lottery baseline
- Regress on annual prize and prize squared, with controls
- Estimate slopes at zero prize and the $32,000 median
Illustrative summary of the source’s quadratic regression for 496 lottery players. Annual prizes range from zero to $500,000; slopes may differ across prize levels.
See source →How
When to use
Researchers evaluate policy interventions where unearned financial transfers contain extreme upper-tail outliers. Fitting standard linear regressions across heavily skewed payment ranges distorts labor supply estimates for typical recipients. Adding polynomial quadratic terms recovers accurate marginal responses across lower and moderate payment levels.
Include quadratic prize terms in linear regression models to capture nonlinear labor earnings responses across skewed financial windfall distributions.
- Define the primary outcome variable as the annual change in labor earnings relative to baseline pre-treatment earnings.
- Enter the annual unearned income transfer amount as a continuous independent variable.
- Construct a squared term of the annual unearned income transfer amount to capture polynomial curvature.
- Estimate parameters using Ordinary Least Squares regression while including baseline demographic controls.
- Calculate derivative estimates of expected labor earnings changes at zero unearned income and at median transfer values.
Why it works
Adding a squared term allows the regression curve to capture steeper labor supply reductions among typical winners without outlier distortion.
Example
Researchers evaluated earnings changes across 496 lottery players in Massachusetts facing prize distributions ranging from zero to 500,000 dollars per year. A standard linear regression yielded an understated labor response of -0.051, whereas adding a quadratic prize term revealed an underlying marginal propensity to earn of -0.114 at prize zero and -0.097 at median prize (32,000 dollars).
About the study
Participants
496 lottery players (259 nonwinners and 237 winners) in Massachusetts.
Study Design
Polynomial Ordinary Least Squares regression evaluating first-differenced Social Security Administration earnings against linear and quadratic lottery prize variables.
Results
Adding the quadratic prize term produced a marginal propensity to earn derivative of -0.114 at prize zero and -0.097 at median prize (32,000 dollars), with the quadratic term achieving a t-statistic of 4.8.