Research analysis
Combine related outcomes into indices
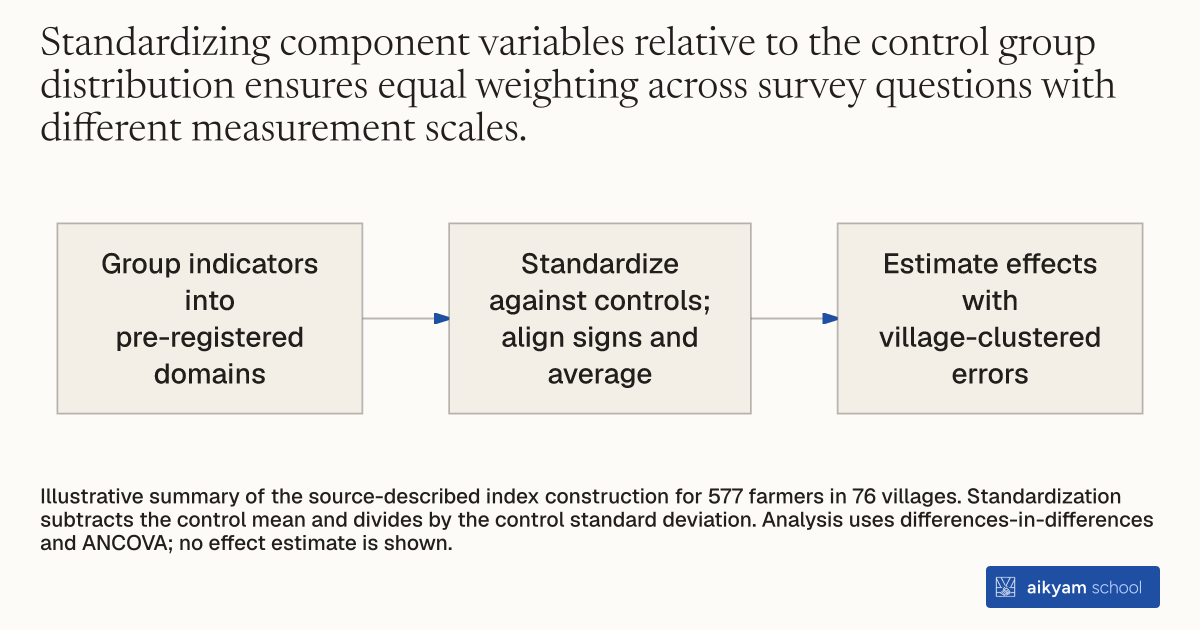
- Group indicators into pre-registered domains
- Standardize against controls; align signs and average
- Estimate effects with village-clustered errors
Illustrative summary of the source-described index construction for 577 farmers in 76 villages. Standardization subtracts the control mean and divides by the control standard deviation. Analysis uses differences-in-differences and ANCOVA; no effect estimate is shown.
See source →How
When to use
Evaluating field experiments with multiple related survey questions creates risk of statistical noise and measurement error across individual variables. Testing individual survey items separately also inflates false discovery rates and obscures overall behavioral shifts. This method aggregates related survey indicators into standardized summary indices to measure treatment impacts across broad outcome domains.
Combine multiple related survey indicators into standardized composite indices using control group distribution parameters to evaluate treatment effects across behavioral domains.
- Group related individual survey indicators into primary pre-registered behavioral domains, such as cropping patterns, off-farm time use, and market interaction.
- Standardize each individual survey variable into a z-score by subtracting the control group mean and dividing by the control group standard deviation.
- Invert the sign of specific component z-scores where necessary so that higher values consistently represent positive or intended outcomes.
- Average the standardized z-scores across all component variables within each domain to form an aggregate index score for each household respondent.
- Estimate treatment effects on the composite domain indices using differences-in-differences and ANCOVA specifications while clustering standard errors at the village level.
Why it works
Aggregating items into domain indices increases statistical power while reducing the risk of selective reporting across multiple individual indicators.
Example
A researcher aggregated survey items into three pre-registered domain indices (cropping patterns, off-farm time use, and prices/market interactions) for 577 smallholders across 76 villages in Migori County, Kenya. Watchman provision increased the cropping patterns index by 0.260 standard deviations (p < 0.05) and the off-farm time use index by 0.242 standard deviations (p < 0.01).
About the study
Participants
577 smallholding farmers across 76 villages in Suna East, Suna West, and Uriri sub-counties, Migori County, Kenya.
Study Design
Aggregation of individual survey indicators into standardized z-score summary indices, evaluated using ANCOVA and differences-in-differences specifications with village-clustered standard errors.
Results
In the ANCOVA specification, watchman assignment increased the Cropping Patterns Index by 0.260 standard deviations (p < 0.05; FDR p = 0.08, FWER p = 0.02), increased the Off-Farm Time Use Index by 0.242 standard deviations (p < 0.01; FDR p = 0.01, FWER p = 0.02), and increased the Prices & Market Interaction Index by 0.139 standard deviations (p < 0.10; FDR p = 0.08, FWER p = 0.12).