Research procedure
Adjust turnout comparisons for contact rate
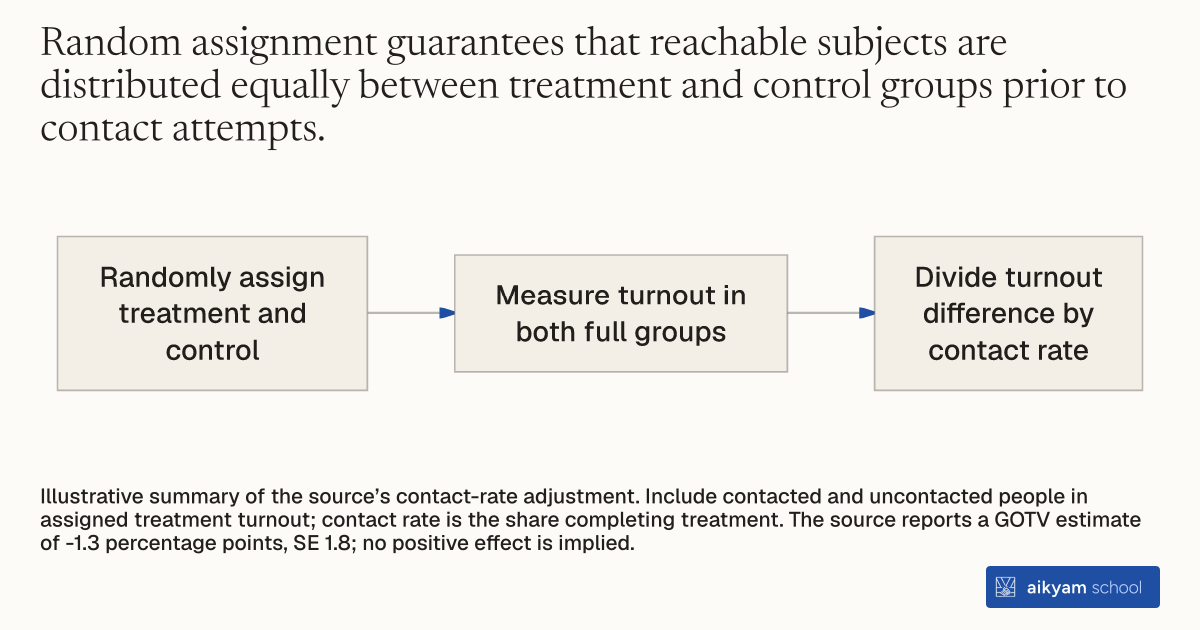
- Randomly assign treatment and control
- Measure turnout in both full groups
- Divide turnout difference by contact rate
Illustrative summary of the source’s contact-rate adjustment. Include contacted and uncontacted people in assigned treatment turnout; contact rate is the share completing treatment. The source reports a GOTV estimate of -1.3 percentage points, SE 1.8; no positive effect is implied.
See source →How
When to use
An evaluator needs to measure the true causal impact of a program where only a subset of the assigned treatment group can be reached. Unadjusted comparisons between contacted participants and uncontacted individuals introduce contactability bias because easy-to-reach subjects differ systematically from hard-to-reach subjects. Dividing the raw difference in group turnout by the contact rate isolates the true treatment effect.
Calculate the unconfounded treatment effect of a contact-based intervention by adjusting for the observed contact rate across experimental groups.
- Assign eligible subjects randomly to an experimental treatment group or an uncontacted control group.
- Measure the overall turnout rate for the entire assigned treatment group, including both contacted and uncontacted subjects.
- Measure the turnout rate for the entire uncontacted control group.
- Subtract the control group turnout rate from the treatment group turnout rate to calculate the overall treatment-control difference.
- Calculate the observed contact rate as the proportion of assigned treatment subjects who completed the intervention.
- Divide the overall treatment-control difference by the contact rate to compute the true treatment effect.
Why it works
Dividing the difference between assigned treatment and control outcomes by the contact rate scales up the observed intention-to-treat effect to reflect the true effect on contacted subjects.
Example
In a 1998 voter mobilization study in West Haven, Connecticut, turnout was 52.9 percent in the GOTV treatment group and 53.5 percent in the control group, yielding a difference of -0.6 percentage points. Dividing -0.6 percentage points by the observed contact rate of 43.5 percent produced an estimated true treatment effect of -1.3 percentage points with a standard error of 1.8.
About the study
Participants
17,100 registered voters (6,843 control, 8,824 GOTV treatment, 1,433 blood drive treatment) in West Haven, CT, during the 1998 general election.
Study Design
Randomized controlled trial using two-stage statistical derivation where turnout in the assigned treatment group minus control turnout is divided by the observed contact rate.
Results
In the GOTV treatment group, treatment group turnout was 52.9 percent, control turnout was 53.5 percent, and contact rate was 43.5 percent, yielding an adjusted treatment effect of -1.3 percentage points (SE = 1.8); in the blood drive group, treatment turnout was 54.2 percent, control turnout was 53.5 percent, and contact rate was 44.0 percent, yielding an adjusted effect of 1.6 percentage points (SE = 3.3).