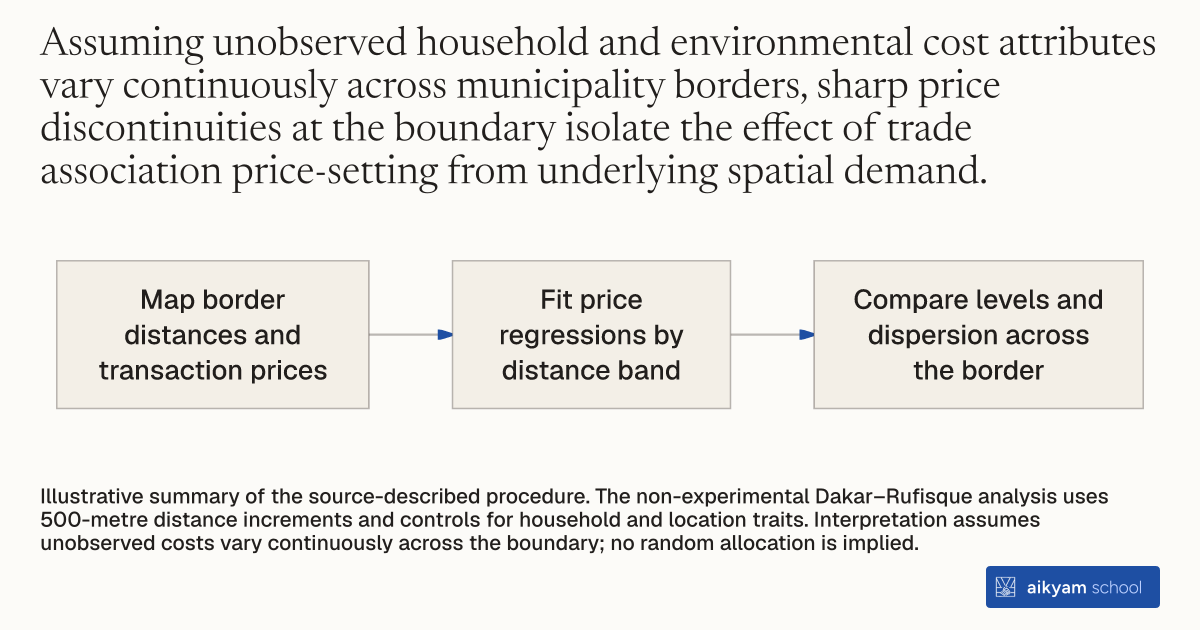
Research steps
Compare prices across a municipal border
- Map border distances and transaction prices
- Fit price regressions by distance band
- Compare levels and dispersion across the border
Illustrative summary of the source-described procedure. The non-experimental Dakar–Rufisque analysis uses 500-metre distance increments and controls for household and location traits. Interpretation assumes unobserved costs vary continuously across the boundary; no random allocation is implied.
See source →How
When to use
Researchers need to evaluate the presence and economic impact of cartel market power in localized service sectors across neighboring municipal jurisdictions. The method addresses unobserved spatial demand or cost heterogeneity by comparing transaction prices across a geographic administrative boundary separating a cartel-controlled zone from an independent market. It is designed for empirical economists and regulatory analysts estimating price distortions and consumer access in urban developing country settings.
Estimate non-experimental price gradients and market power by comparing household service transaction prices across administrative municipal boundaries.
- Analysts map municipal boundaries separating regions controlled by trade associations from adjacent independent jurisdictions.
- Analysts measure household spatial distance from each survey location to the nearest jurisdictional boundary line.
- Analysts collect historical household transaction prices and service choice data on both sides of the boundary.
- Analysts estimate price schedule regressions as a step function of distance to the border while controlling for household and neighborhood attributes.
- Analysts compare predicted price levels and price dispersion across distance bands to identify spatial spillovers and local market power.
Why it works
Flat price schedules inside independent zones combined with steep price gradients outside the border confirm that cartel firms restrict supply and maintain local markups.
Example
Researchers compared mechanized desludging transaction prices in Dakar, Senegal between areas controlled by the AAAS trade association and the adjacent independent municipality of Rufisque. Controlling for household distance to treatment centers, garages, and wealth, prices in Rufisque averaged 15,000 CFA compared to 25,000 CFA in Dakar, causing mechanized desludging adoption to reach over 90% in Rufisque versus 40% across the rest of Dakar.
About the study
Participants
4,409 household transaction observations from Dakar and 394 household observations from Rufisque across seven residential arrondissements in Dakar, Senegal.
Study Design
Spatial border-discontinuity regression model evaluating transaction prices as a step function of 500-meter distance increments from the Rufisque municipal boundary, controlling for household wealth, structural characteristics, and proximity to treatment plants and garages.
Results
Mechanized desludging transaction prices in Association-controlled Dakar increased rapidly beyond 1 km from the Rufisque border to 25,000 CFA (an 8,230 CFA markup beyond 5 km), while prices in Rufisque remained flat at 15,000 CFA with a within-neighborhood residual inter-quartile range of 1,800 CFA compared to 8,600 CFA in the rest of Dakar.