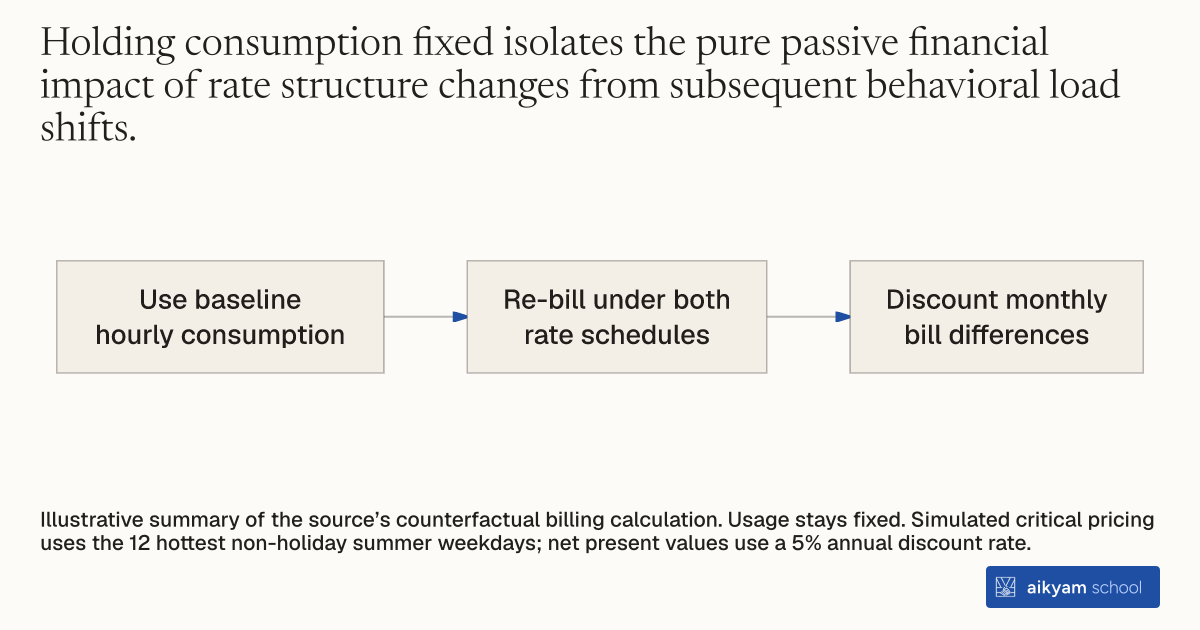
Research procedure
Compare bills with unchanged usage
- Use baseline hourly consumption
- Re-bill under both rate schedules
- Discount monthly bill differences
Illustrative summary of the source’s counterfactual billing calculation. Usage stays fixed. Simulated critical pricing uses the 12 hottest non-holiday summer weekdays; net present values use a 5% annual discount rate.
See source →How
When to use
Energy economists and public utility analysts evaluate proposed electricity tariff changes to determine how baseline household consumption determines financial wins or losses before behavioral adjustments. Without evaluating unadjusted structural gains, program designers cannot distinguish between passive financial impacts and active behavior shifts. This method applies pre-treatment hourly consumption data to counterfactual rate structures to calculate baseline net present value structural gains or losses for each household.
Calculate household-level structural gains by applying pre-treatment hourly electricity usage data to proposed time-varying tariff schedules.
- Econometricians extract one year of baseline hourly electricity consumption data per household from smart meters during the pre-treatment period (June through September 2011).
- Econometricians select the 12 hottest non-holiday summer weekdays in the baseline year to simulate Critical Peak Pricing event days.
- Econometricians re-bill each household's baseline hourly usage under the proposed time-varying pricing schedule and the standard flat rate schedule.
- Econometricians calculate monthly structural gains by subtracting projected time-varying bill totals from standard flat-rate bill totals, holding consumption patterns fixed.
- Econometricians discount monthly structural gains across the multi-year program horizon using a 5 percent annual discount rate to compute net present value gains per household.
Why it works
Comparing baseline counterfactual bills across households reveals whether financial incentives predict program participation choices.
Example
Researchers evaluated 174,000 residential utility households in Sacramento, California using 2011 smart meter data, revealing that 51 percent were structural winners under Critical Peak Pricing with average net present value gains of \$0.33, while 34 percent were structural winners under Time-of-Use pricing with average losses of \$10.54.
About the study
Participants
174,000 residential utility households in Sacramento, California.
Study Design
Counterfactual billing simulation applying 2011 pre-treatment hourly usage data to CPP and TOU rate structures discounted at a 5 percent annual rate.
Results
Over 93 percent of households faced monthly bill changes under \$10 (96 percent for CPP and 93 percent for TOU), with structural gains showing virtually no correlation with household program participation choices (slopes between -0.0006 and 0.0003).