Research measurement
Track energy use around report arrivals
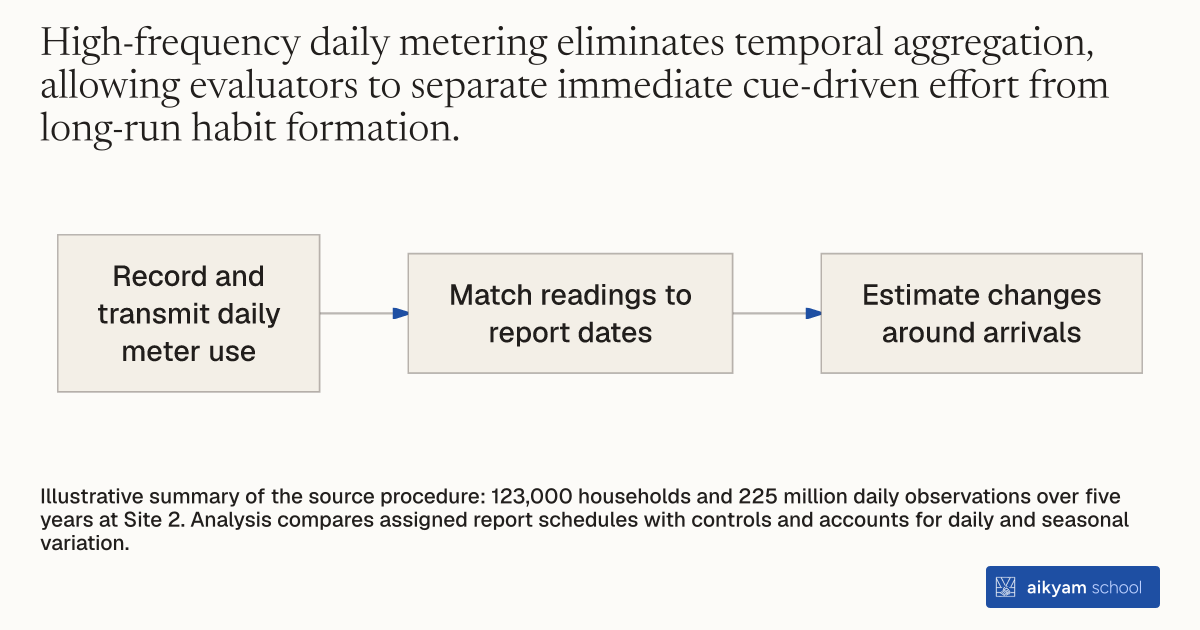
- Record and transmit daily meter use
- Match readings to report dates
- Estimate changes around arrivals
Illustrative summary of the source procedure: 123,000 households and 225 million daily observations over five years at Site 2. Analysis compares assigned report schedules with controls and accounts for daily and seasonal variation.
See source →How
When to use
Standard monthly utility meter reads aggregate consumption across billing cycles, masking short-run behavioral dynamics and immediate responses to interventions. Deploying advanced smart meters that automatically record daily electricity usage resolves this temporal coarseness for energy researchers and program evaluators. High-frequency daily monitoring enables precise measurement of short-run action, rapid backsliding, and immediate cue-driven conservation responses among residential utility customers.
Deploy advanced metering infrastructure to record high-frequency daily residential electricity usage for granular program evaluation and empirical estimation.
- Equip residential single-family homes with advanced electricity smart meters that record consumption each day.
- Transmit daily meter readings automatically to utility databases, compiling high-frequency time series over multi-year study periods.
- Identify exact report generation, printing, mailing, and estimated postal arrival dates for treated households.
- Estimate daily average treatment effects using regressions that control for day-specific constants and seasonal baseline usage.
- Analyze daily consumption trajectories over multi-day moving windows surrounding report arrivals to track immediate post-arrival conservation and subsequent inter-report decay.
Why it works
It also enables researchers to control for daily weather fluctuations that would otherwise confound behavioral conservation estimates.
Example
In Site 2, an electric utility in a West Coast suburb deployed smart meters to track 225 million daily energy observations across 123,000 households over five years, detecting immediate post-report consumption drops of 0.3 to 0.4 kWh per day.
About the study
Participants
123,000 residential single-family households in Site 2 in the West Coast United States.
Study Design
High-frequency randomized control trial analyzing 225 million daily household electricity observations across monthly, quarterly, and bimonthly treatment groups relative to control groups.
Results
Daily metering revealed an immediate consumption decrease of 0.185 to 0.197 kWh per day in the seven days following initial report arrivals, followed by a backsliding decay rate of 0.708 kWh per day per year between quarterly reports.