Research estimation
Estimate income inequality from housing
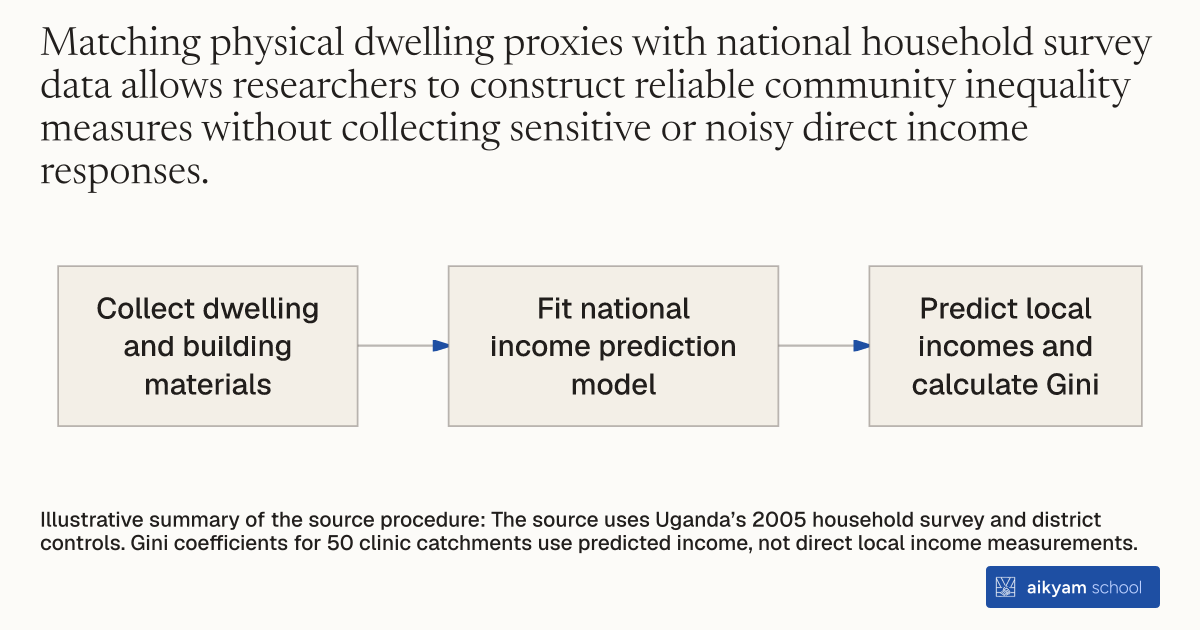
- Collect dwelling and building materials
- Fit national income prediction model
- Predict local incomes and calculate Gini
Illustrative summary of the source procedure: The source uses Uganda’s 2005 household survey and district controls. Gini coefficients for 50 clinic catchments use predicted income, not direct local income measurements.
See source →How
When to use
Field surveys in developing countries often collect physical wealth proxies rather than direct household income figures. Evaluating how income inequality impacts local collective action requires estimating community-level inequality indices from these asset proxies. This method predicts household income using dwelling characteristics matched against national survey data to calculate Gini coefficients across dispensary catchment areas.
Estimate household income and calculate community-level Gini coefficients by matching local dwelling asset proxies with national household survey data.
- Primary survey teams collect household asset proxies, including dwelling type and construction materials of the roof and external walls, across target communities.
- Econometricians extract household income and matching dwelling characteristics from a representative national dataset, such as the Uganda National Household Survey 2005.
- Econometricians regress national household income on dwelling characteristics and district fixed effects to generate prediction coefficients.
- Econometricians apply these predicted coefficients to local household asset proxies to estimate household-level income across project catchment areas.
- Econometricians compute community-specific Gini coefficients using the estimated household income values for each primary health dispensary catchment area.
Why it works
The resulting Gini coefficients quantify local income dispersion to test its relationship with public good provision and monitoring outcomes.
Example
Researchers combined wealth proxies from 50 primary health clinic catchment areas in Uganda with the 2005 Uganda National Household Survey to estimate local Gini coefficients. In the treatment group, the baseline Gini coefficient averaged 0.096 compared to 0.085 in the control group, enabling researchers to test how income inequality interacts with community health monitoring interventions.
About the study
Participants
50 primary health care dispensary catchment areas across 9 rural districts in Uganda.
Study Design
Combining primary survey dwelling proxy data with 2005 Uganda National Household Survey data via predictive OLS regression with district fixed effects to construct Gini coefficients for randomized field experiment analysis.
Results
Baseline community Gini coefficients averaged 0.096 (standard error 0.01) in treatment communities and 0.085 (standard error 0.01) in control communities, with an estimated difference of 0.01 (standard error 0.014).