Research procedure
Map and analyse neighbour exposure
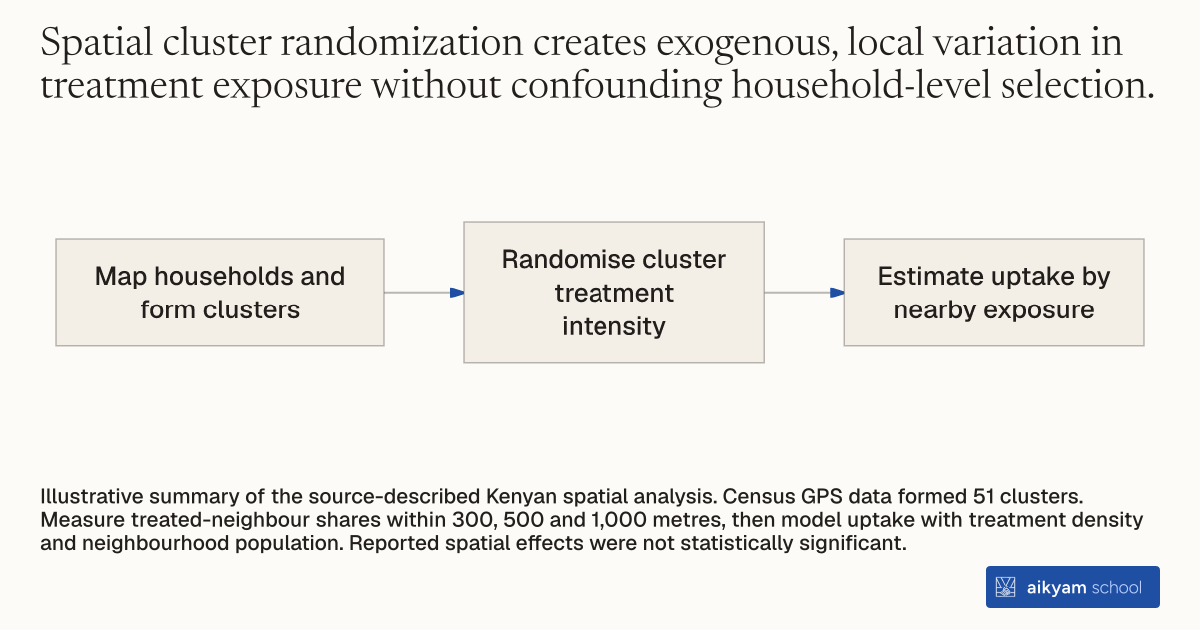
- Map households and form clusters
- Randomise cluster treatment intensity
- Estimate uptake by nearby exposure
Illustrative summary of the source-described Kenyan spatial analysis. Census GPS data formed 51 clusters. Measure treated-neighbour shares within 300, 500 and 1,000 metres, then model uptake with treatment density and neighbourhood population. Reported spatial effects were not statistically significant.
See source →How
When to use
Interventions in developing areas often spread beyond target households through social learning or spatial proximity to nearby neighbors. Use this method when evaluating a health project to measure whether adoption by neighbors stimulates or suppresses adoption among nearby households. It applies to field experiments testing peer influences, spatial externalities, or imitative adoption across rural communities.
Map precise household geographic coordinates using handheld GPS devices to construct spatial clusters and vary treatment intensity across geographic radii.
- Conduct a door-to-door village census to log every household's precise latitude and longitude coordinates.
- Group households into distinct geographic clusters based on spatial coordinates.
- Randomly assign treatment protocols across clusters with stratified intensities to vary the proportion of treated households within specified geographic radii.
- Measure social and geographical exposure by calculating the proportion of treated neighbors within 300-meter, 500-meter, and 1,000-meter radii of each household.
- Estimate spatial spillover effects by regressing individual uptake on local treatment density and total neighborhood population.
Why it works
This allows researchers to isolate pure spatial and imitative peer mechanisms from general community-wide trends.
Example
In Busia and Samia Districts of Western Kenya, field teams recorded GPS coordinates for 1,547 census households and formed 51 geographic clusters across two villages. Researchers randomly varied the density of discount coupon and health script recipients across 300-meter, 500-meter, and 1,000-meter radii around 999 surveyed households, finding that having a higher proportion of treated neighbors within 300 meters produced no statistically significant change in coupon redemption (+7.3 percentage points, p > 0.10).
About the study
Participants
999 surveyed households across 51 geographic clusters in Busia and Samia Districts of Western Kenya, living on roughly \$1 per day.
Study Design
Cluster-randomized trial stratifying coupon prices and health scripts by GPS-defined geographic clusters, estimating spatial spillovers at 300m, 500m, and 1,000m radii using OLS regressions with cluster controls.
Results
Geographic treatment intensity had no statistically significant impact on product adoption; the proportion of neighbors receiving discounts below 35 Ksh within 300 meters changed purchase probability by +7.3 percentage points (p > 0.10), while script exposure changed it by +5.7 percentage points (p > 0.10).