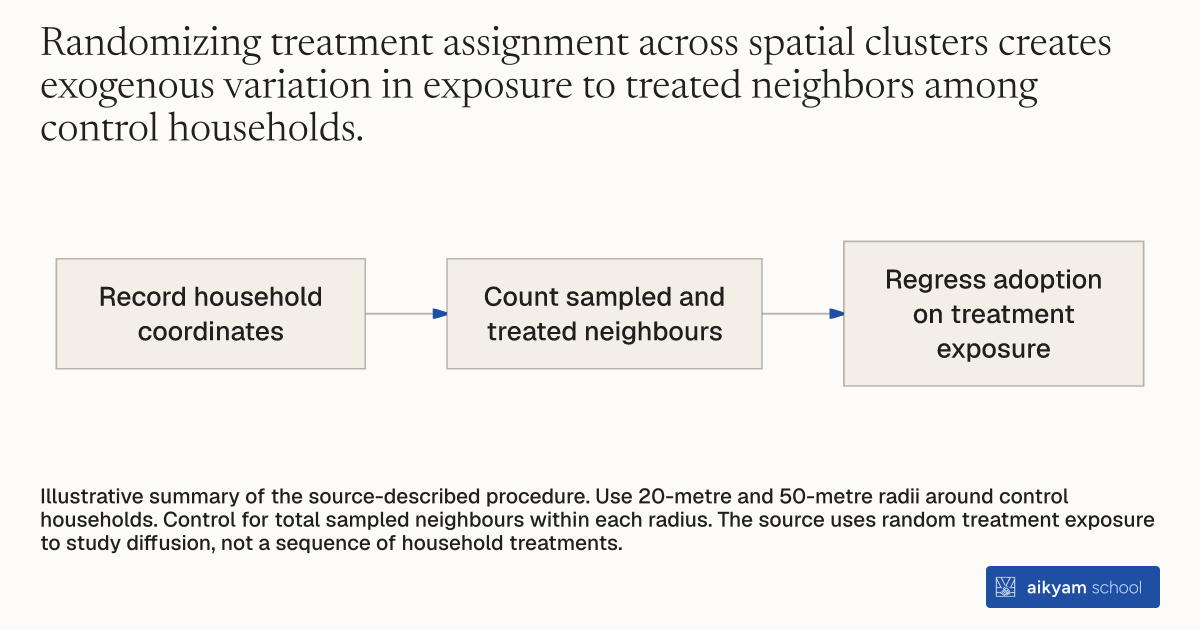
Research steps
Measure exposure to treated neighbours
- Record household coordinates
- Count sampled and treated neighbours
- Regress adoption on treatment exposure
Illustrative summary of the source-described procedure. Use 20-metre and 50-metre radii around control households. Control for total sampled neighbours within each radius. The source uses random treatment exposure to study diffusion, not a sequence of household treatments.
See source →How
When to use
In infrastructure programs, estimating social diffusion across neighbor networks is often confounded by endogenous neighborhood selection. This method measures peer influence by mapping household geographic coordinates to exploit exogenous variation in nearby treatment density. It allows program evaluators to isolate pure word-of-mouth adoption spillovers from shared spatial infrastructure effects.
Measure social diffusion and peer adoption spillovers by mapping household GPS locations and estimating exposure to randomly assigned treatment neighbors.
- Surveyors record exact GIS geographic coordinates (longitude and latitude) for all participating household plots.
- Spatial analysts compute spatial buffer radii around each control household at fixed distances of 20 meters and 50 meters.
- Spatial analysts calculate the total number of study-sampled neighbors and the count of treatment-assigned neighbors residing within each radius.
- Econometricians regress control group adoption choices on the count or share of treated neighbors within each spatial radius.
- Econometricians control for the total number of sampled neighbor plots within the radius to isolate random variation in treatment exposure.
Why it works
Controlling for total neighboring study plots isolates the social learning effect from underlying geographic density or shared local infrastructure.
Example
In Tangiers, Morocco, researchers recorded GPS coordinates for 411 control households to evaluate adoption diffusion 18 months after the baseline intervention. Among control households with neighbors within 20 meters, having at least one treated neighbor increased connection adoption by 18 percentage points (from 15 percent to 33 percent).
About the study
Participants
221 control households with at least one sampled neighbor within a 20-meter radius in Tangiers, Morocco.
Study Design
Spatial GPS mapping combined with cluster-randomized encouragement variation to estimate linear probability regressions of control group adoption on treated neighbor counts.
Results
Control households with at least one treated neighbor within 20 meters were 17.6 percentage points more likely to adopt a piped connection by August 2009 compared to a 15 percent baseline take-up among control households without treated neighbors.