Research procedure
Estimate differences between subgroups
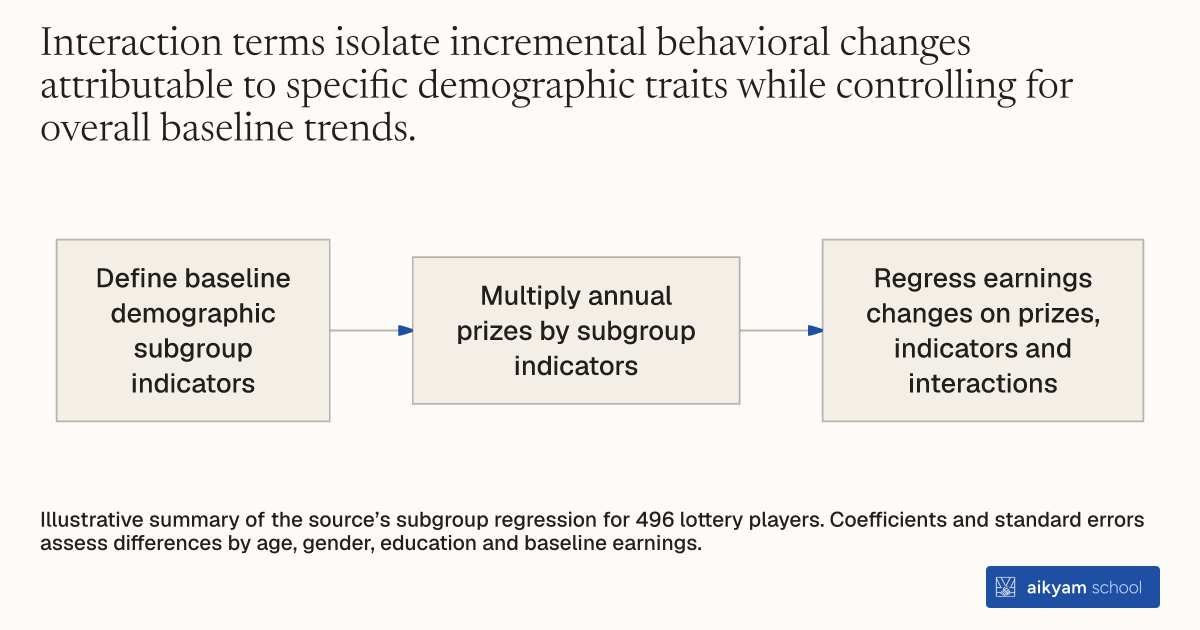
- Define baseline demographic subgroup indicators
- Multiply annual prizes by subgroup indicators
- Regress earnings changes on prizes, indicators and interactions
Illustrative summary of the source’s subgroup regression for 496 lottery players. Coefficients and standard errors assess differences by age, gender, education and baseline earnings.
See source →How
When to use
Researchers evaluate policy interventions to determine whether behavioral responses vary across distinct population subgroups. Average treatment effects can mask critical differences across age, gender, education, or income tiers. Adding interaction terms between treatment variables and demographic indicators isolates subgroup-specific treatment responses.
Estimate subgroup-specific treatment effects by regressing outcomes on interaction terms between treatment variables and demographic indicator variables.
- Select baseline demographic categories including gender, age groups, education levels, and initial baseline earnings tiers.
- Construct binary indicator dummy variables for each demographic subgroup category.
- Multiply the continuous annual treatment variable by each binary subgroup indicator to generate interaction terms.
- Regress the change in annual labor earnings on the primary treatment variable, demographic indicator variables, and interaction terms.
- Evaluate interaction parameter coefficients and standard errors to identify statistically significant behavioral differences across subgroups.
Why it works
This prevents aggregate group averages from masking targeted policy impacts among vulnerable or near-retirement populations.
Example
Researchers evaluated 496 Massachusetts lottery players to test if unearned income responses differed by age, gender, education, and baseline earnings. Interacting yearly prizes with age indicators showed that players aged 55 to 65 reduced labor earnings significantly more than younger players, generating an interaction coefficient of -0.167.
About the study
Participants
496 lottery players (259 nonwinners and 237 winners) in Massachusetts.
Study Design
OLS panel regression with interacted treatment and demographic variables evaluating first-differenced Social Security earnings records across six post-winning years.
Results
Workers aged 55 to 65 exhibited an additional labor reduction interaction coefficient of -0.167 (standard error 0.070), while female interaction coefficients (+0.002) and education interaction coefficients showed no statistically significant differences.