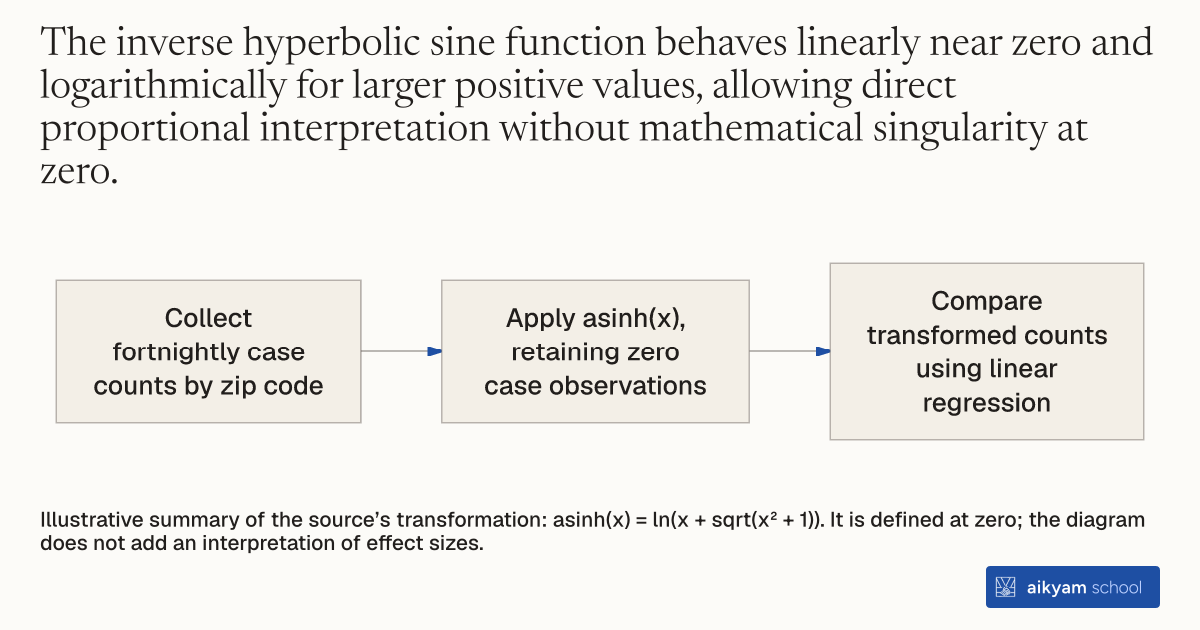
Research procedure
Transform counts before regression
- Collect fortnightly case counts by zip code
- Apply asinh(x), retaining zero case observations
- Compare transformed counts using linear regression
Illustrative summary of the source’s transformation: asinh(x) = ln(x + sqrt(x² + 1)). It is defined at zero; the diagram does not add an interpretation of effect sizes.
See source →How
When to use
Public health researchers evaluating regional disease counts often analyze highly skewed data that closely follow log-normal distributions. Standard logarithmic transformations fail when small administrative units report zero new infections because the logarithm of zero is mathematically undefined. The inverse hyperbolic sine transformation resolves this issue by approximating logarithmic behavior while remaining well-defined at zero.
Apply the inverse hyperbolic sine transformation to raw disease case counts before estimating linear regression models.
- Data analysts retrieve raw fortnightly COVID-19 case counts across targeted postal zip codes.
- Statisticians apply the transformation formula asinh(x) = ln(x + sqrt(x^2 + 1)) to raw case numbers for each zip code.
- Econometricians verify that low-value zero case observations transform smoothly without requiring artificial constant additions.
- Analysts estimate ordinary least squares regressions using transformed case counts as the primary continuous outcome variable.
- Researchers interpret estimated treatment coefficients directly as proportional percentage changes in regional infection counts.
Example
Researchers transformed fortnightly COVID-19 case totals across 6,998 US zip codes to evaluate the impact of holiday social media ad campaigns on infection rates.
About the study
Participants
6,998 unique zip codes across 820 counties in 13 US states.
Study Design
OLS regressions estimating the inverse hyperbolic sine of fortnightly COVID-19 cases in treated versus control zip codes during 2-week periods starting 5 days post-holiday.
Results
The adjusted difference in the inverse hyperbolic sine of COVID-19 cases was -0.035 (P = 0.013), representing a 3.5% reduction in infections in treated zip codes relative to controls.