Research procedure
Build local infection measures
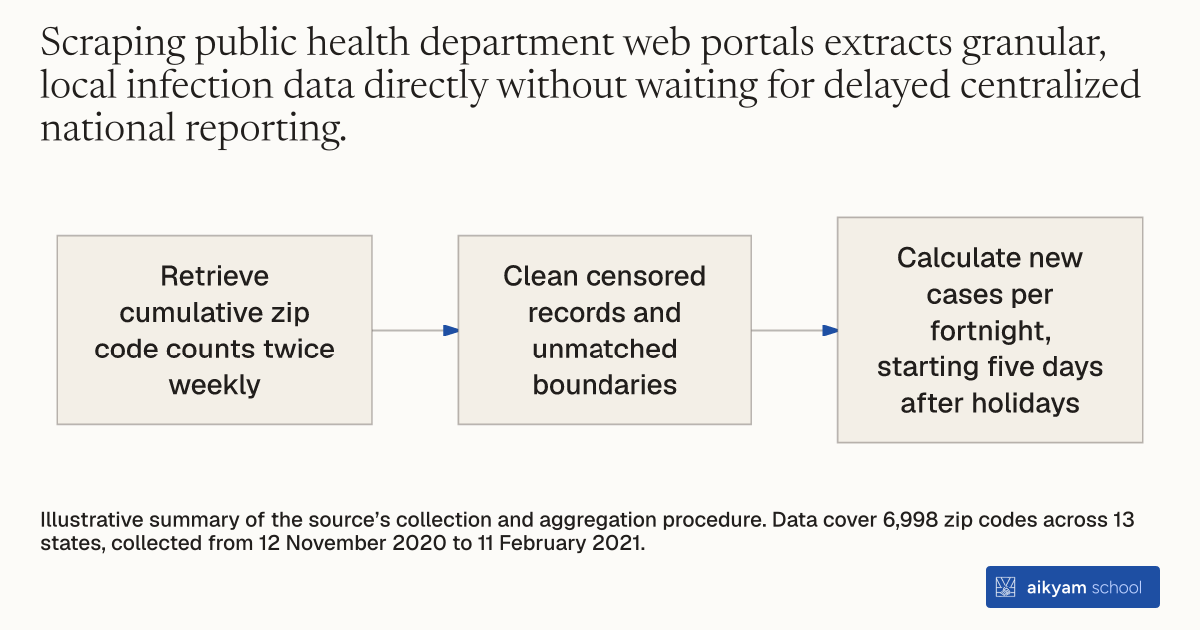
- Retrieve cumulative zip code counts twice weekly
- Clean censored records and unmatched boundaries
- Calculate new cases per fortnight, starting five days after holidays
Illustrative summary of the source’s collection and aggregation procedure. Data cover 6,998 zip codes across 13 states, collected from 12 November 2020 to 11 February 2021.
See source →How
When to use
Researchers need localized disease transmission metrics across thousands of postal codes to evaluate public health campaigns. Centralized nationwide datasets often lack fine-grained local geographic data or update too slowly for immediate evaluation. Systematically scraping state public health dashboards provides granular, regular infection counts for cluster-level evaluation.
Collect and clean public health case data twice weekly from state health department websites across targeted zip codes.
- Research staff identify official state health department websites that report cumulative COVID-19 case counts at the zip code level.
- Data collectors retrieve case counts twice per week from public state web pages between November and February.
- Analysts clean retrieved web records by dropping censored zip codes with low case counts and resolving unmatched census boundaries.
- Data engineers combine individual state datasets into a single database covering 6,998 unique zip codes.
- Econometricians calculate fortnightly new case totals starting five days after campaign events to measure clinical intervention impacts.
Example
Researchers manually retrieved case counts twice weekly from public health websites across 13 US states from November 12, 2020 to February 11, 2021, compiling clean data for 6,998 unique zip codes.
About the study
Participants
6,998 unique zip codes with non-censored data across 820 counties in 13 US states.
Study Design
Manual and automated web retrieval twice per week from 13 state health department public portals to construct fortnightly infection metrics.
Results
Zip-code level infection counts declined by 3.5% (P = 0.013) in treated zip codes relative to control zip codes during the fortnight starting 5 days post-holiday.