Research procedure
Select baseline adjustment variables
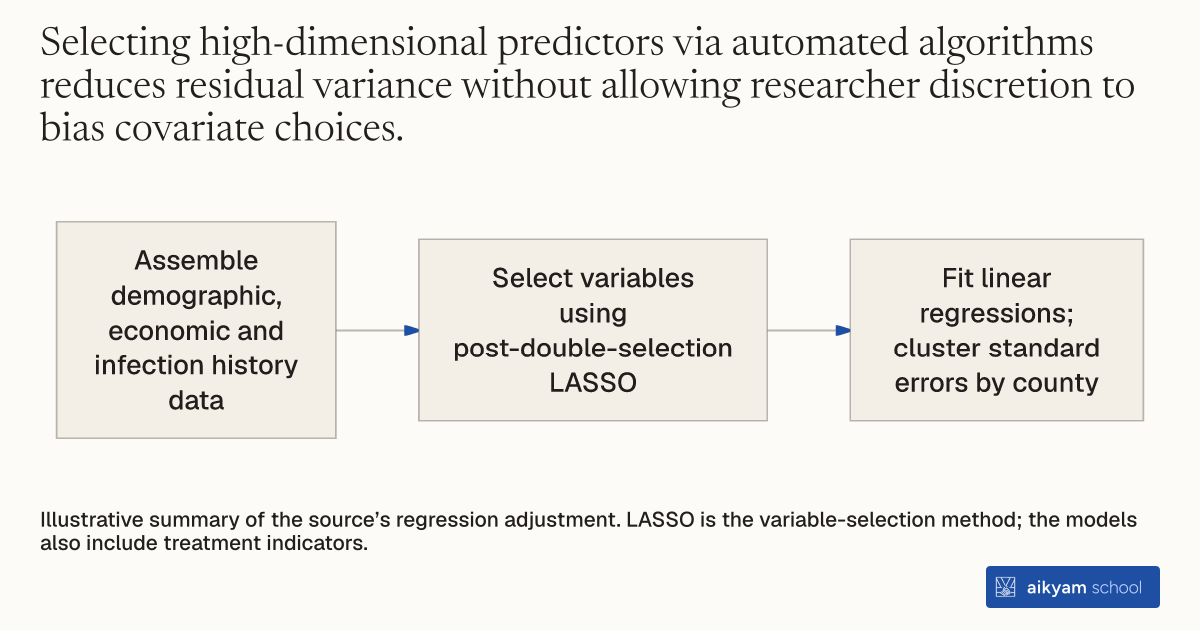
- Assemble demographic, economic and infection history data
- Select variables using post-double-selection LASSO
- Fit linear regressions; cluster standard errors by county
Illustrative summary of the source’s regression adjustment. LASSO is the variable-selection method; the models also include treatment indicators.
See source →How
When to use
In randomized trials evaluating public health interventions across thousands of regions, outcomes are influenced by many baseline demographic and epidemiological variables. Including too many collinear variables causes variance inflation, while omitting key predictors reduces statistical precision. Machine learning selection identifies optimal baseline covariates to maximize statistical precision without introducing researcher bias.
Select baseline covariates in regression models using machine learning algorithms to increase treatment effect precision.
- Data analysts assemble baseline demographic, economic, and historical infection covariates across all target geographic units.
- Statisticians run post-double-selection LASSO algorithms to select the most predictive baseline covariates for outcome variables.
- Econometricians estimate ordinary least squares regressions including the selected baseline covariates alongside treatment indicators.
- Analysts calculate cluster-robust standard errors aggregated at the county level to account for spatial correlation.
Example
Researchers applied post-double-selection LASSO to select baseline covariates across 6,998 zip codes in 13 US states, evaluating social media ad campaign impacts on COVID-19 infections.
About the study
Participants
6,998 unique zip codes across 820 counties in 13 US states.
Study Design
OLS regressions with post-double-selection LASSO covariate adjustment and standard errors clustered at the county level.
Results
Covariate-adjusted regressions demonstrated a 3.5% drop in COVID-19 cases (P = 0.013) in treated zip codes and a 0.993 percentage point drop in pre-holiday travel distance (P = 0.002).