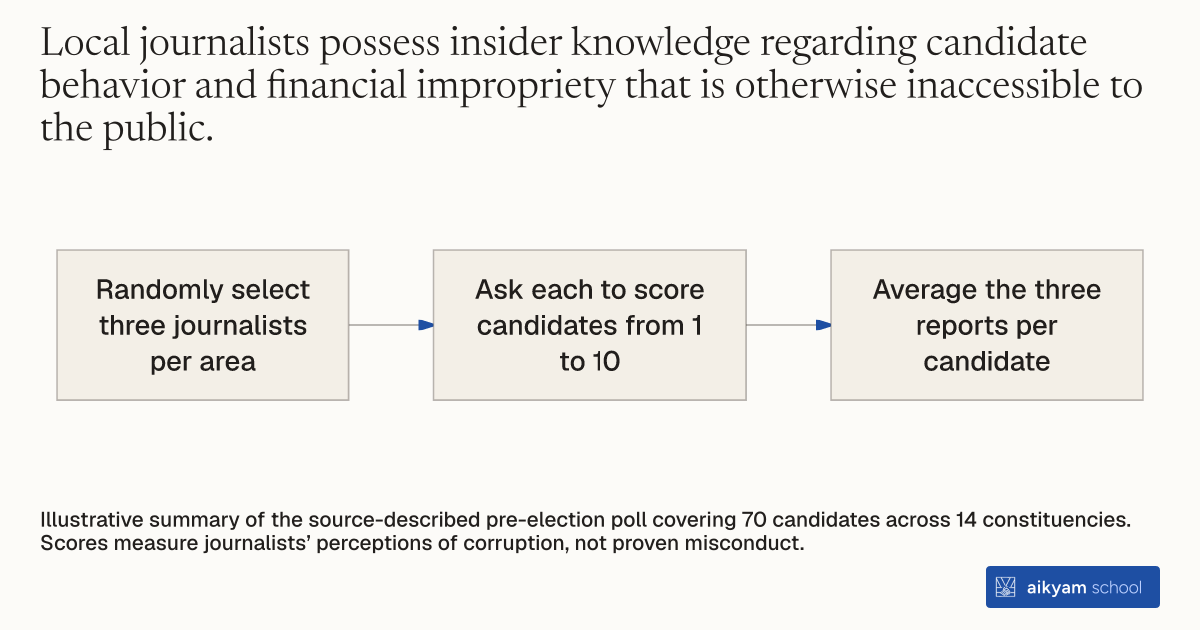
Research procedure
Collect perceived corruption rankings
- Randomly select three journalists per area
- Ask each to score candidates from 1 to 10
- Average the three reports per candidate
Illustrative summary of the source-described pre-election poll covering 70 candidates across 14 constituencies. Scores measure journalists’ perceptions of corruption, not proven misconduct.
See source →How
When to use
In developing democracies, objective official data on political corruption is rarely available before elections, leaving voters reliant on vague partisan accusations. A journalist expert poll assesses candidate corruption by surveying experienced local journalists who track political actors. This provides researchers and evaluators with structured pre-election candidate corruption rankings across major political parties.
Poll local media experts prior to an election to create standardized corruption rankings for political candidates.
- Compile a comprehensive list of prominent journalists covering the election within each target electoral jurisdiction.
- Randomly select three journalists per jurisdiction from the compiled list prior to the election.
- Interview each selected journalist about candidates from all major contesting political parties in that jurisdiction.
- Prompt journalists to score each candidate's perceived corruption on a standardized 1 to 10 scale.
- Aggregate the three expert reports per politician to calculate a mean corruption ranking for every candidate.
Why it works
Aggregating multiple independent journalist rankings mitigates individual bias and produces a reliable relative metric of candidate corruption.
Example
In 14 assembly constituencies across central Uttar Pradesh, India, researchers randomly selected three local journalists per jurisdiction prior to the 2007 state assembly election to evaluate 70 candidates from four major parties. Across all evaluated politicians, the average candidate received a normalized corruption rank of 5 out of 10, with candidates facing criminal charges scoring significantly higher on perceived corruption.
About the study
Participants
The expert poll evaluated 70 candidates across four major political parties in 14 state assembly constituencies across Lalitpur, Bahraich, and Sitapur districts in rural Uttar Pradesh, India.
Study Design
Researchers randomly sampled three prominent local journalists per jurisdiction shortly before the election, interviewed each about all major party candidates, and compiled three independent reports per politician to construct a 1-10 normalized candidate corruption index.
Results
The mean candidate corruption rank was 5 on a 1-10 scale; candidate corruption scores were subsequently used in an RCT to test whether anti-corruption voter campaigns reduced votes for high-corruption candidates, finding no reduction in corrupt candidate vote shares (point estimate +0.103; p > 0.1).