Research measurement
Measure distance from the weekly workload target
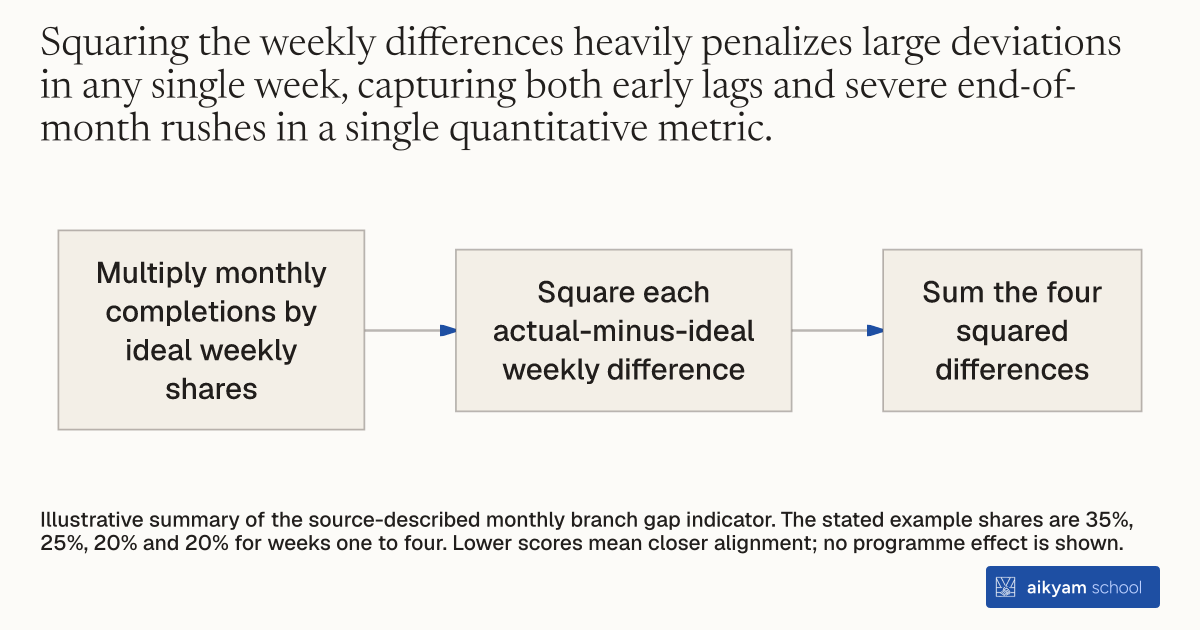
- Multiply monthly completions by ideal weekly shares
- Square each actual-minus-ideal weekly difference
- Sum the four squared differences
Illustrative summary of the source-described monthly branch gap indicator. The stated example shares are 35%, 25%, 20% and 20% for weeks one to four. Lower scores mean closer alignment; no programme effect is shown.
See source →How
When to use
Organizations that set monthly quotas often lack a quantitative tool to track whether employees spread effort evenly across weeks or compress work into end-of-period rushes. Measuring weekly deviation from an optimal target distribution provides an aggregate metric of task smoothing over time. This approach allows operations managers and evaluators to evaluate time-allocation changes across regional offices.
Calculate a monthly gap indicator to measure how closely actual weekly task performance matches an organization's ideal distribution of effort.
- Operations managers define the ideal percentage distribution of monthly completed tasks across the four weeks of a month (for example, 35 percent in week one, 25 percent in week two, 20 percent in week three, and 20 percent in week four).
- Evaluators multiply the total actual monthly task completions by these ideal percentages to determine the ideal weekly target count for each branch.
- Analysts record the actual number of completed tasks achieved by each branch during each week of the month.
- Analysts subtract the ideal weekly target count from the actual weekly completed tasks for each week and square each resulting weekly difference.
- Evaluators sum the squared weekly differences across all four weeks to produce the overall monthly branch gap indicator, where a lower score indicates closer alignment with ideal work smoothing.
Why it works
This summary indicator enables clear statistical comparison of workload smoothing between treatment and control groups over time.
Example
In Colombia, researchers evaluated Bancamía branches by calculating monthly gap indicators based on an ideal weekly placement distribution of 35 percent, 25 percent, 20 percent, and 20 percent across four weeks. During the Madrugador Program, treatment branches reduced their distance from the ideal distribution by an average gap indicator reduction of 9.58 to 9.84 points compared to control branches.
About the study
Participants
61 bank branches (31 treatment, 30 control) managing ~180,000 micro-business loans across Colombia.
Study Design
Randomized controlled trial using monthly administrative data from July 2008 to April 2009 evaluated via OLS panel regressions with branch and month fixed effects and standard errors clustered at the branch level.
Results
The Madrugador Program reduced the gap indicator distance to ideal task distribution by 6.7 points overall (p < 0.10) and by 9.58 points (p < 0.05; with controls 9.84 points, p < 0.01) during Phase 2 when branch managers provided weekly reminders, reflecting a 12% closer approximation to ideal task smoothing.