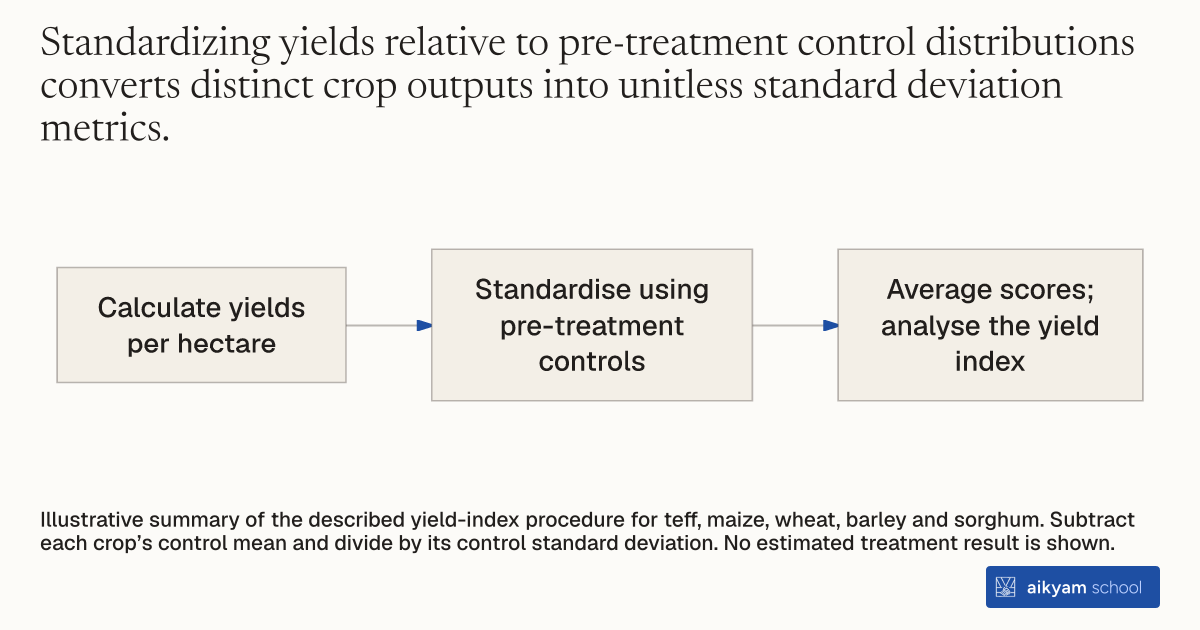
Research steps
Put crop yields on a common scale
- Calculate yields per hectare
- Standardise using pre-treatment controls
- Average scores; analyse the yield index
Illustrative summary of the described yield-index procedure for teff, maize, wheat, barley and sorghum. Subtract each crop’s control mean and divide by its control standard deviation. No estimated treatment result is shown.
See source →How
When to use
Smallholder farmers cultivate diverse combinations of food and cash crops across varied soil conditions and microclimates. Comparing raw physical yields across different crop species creates aggregation bias when measuring overall farm productivity changes. Constructing a normalized yield z-score index standardizes individual crop yields into a single metric to evaluate aggregate farm-level agricultural performance.
Construct a normalized multi-crop yield z-score index across target crops to measure aggregate farm productivity changes.
- Identify the primary regional crops grown and insured across study farming villages, including teff, maize, wheat, barley, and sorghum.
- Collect plot-level physical harvest quantities and cultivated land area across baseline survey rounds to calculate per-hectare yields for each crop.
- Compute the mean and standard deviation of yields per hectare for each crop using control group distribution data from pre-treatment rounds.
- Normalize individual crop yields by subtracting the crop-specific control mean and dividing by its standard deviation.
- Calculate the unweighted average of these normalized z-scores across all crops cultivated by an individual farming household in a given year.
- Use the aggregate household z-score index as a dependent variable in panel regression models to evaluate productivity impacts across experimental treatment arms.
Why it works
Averaging these normalized scores prevents high-mass bulky crops from dominating productivity measurements across heterogeneous multi-cropping households.
Example
Researchers calculated normalized yield index scores across 5 major crops for 882 panel households in Amhara, Ethiopia, finding that receiving free insurance vouchers caused no statistically significant change in aggregate yields (-0.0207 standard deviations, p > 0.1).
About the study
Participants
882 panel cooperative farming households across 49 villages in Amhara Region, Ethiopia.
Study Design
Normalized z-score index construction across 5 insured crops (teff, maize, wheat, barley, sorghum) evaluated using panel fixed-effects difference-in-differences regressions.
Results
Calculated baseline control yield means and standard deviations across two pre-treatment rounds, finding that insurance voucher receipt produced a statistically insignificant yield change of -0.0207 standard deviations (p > 0.1).