Research analysis
Classify crops by theft opportunity
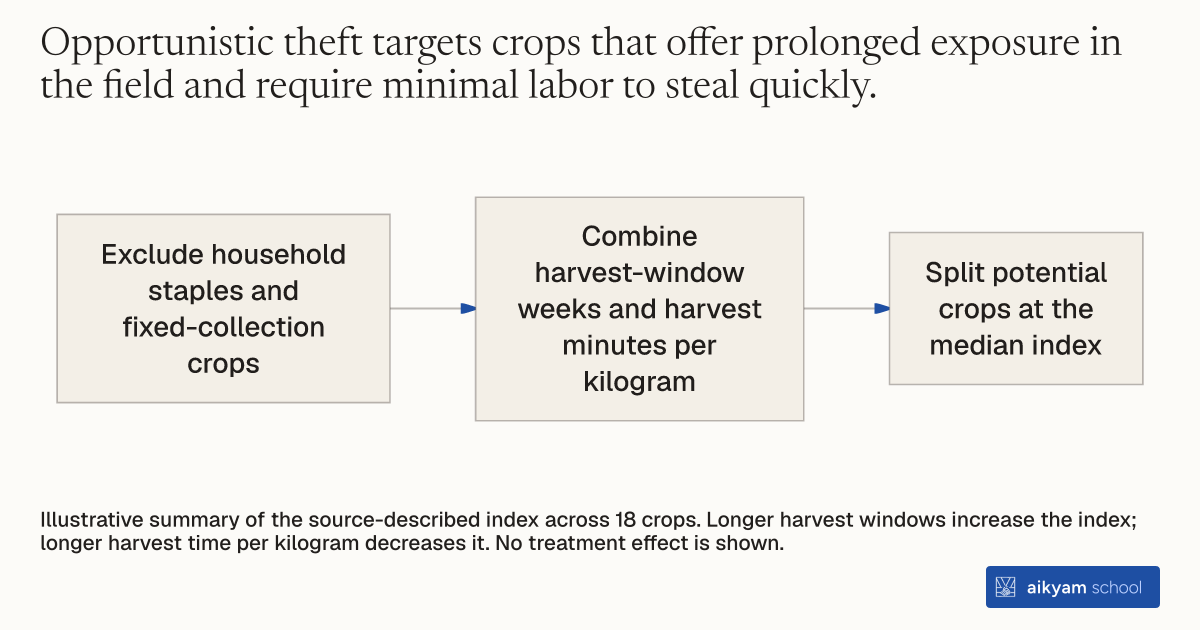
- Exclude household staples and fixed-collection crops
- Combine harvest-window weeks and harvest minutes per kilogram
- Split potential crops at the median index
Illustrative summary of the source-described index across 18 crops. Longer harvest windows increase the index; longer harvest time per kilogram decreases it. No treatment effect is shown.
See source →How
When to use
Agricultural development programs often lack objective criteria to classify crops by their vulnerability to opportunistic theft. Subjective farmer perceptions vary widely, making it difficult to assess how security risks influence crop choice. This method constructs a standardized theft-vulnerability index using observable physical and harvesting characteristics of crops.
Classify crops into objective theft-risk categories based on their physical harvest duration and harvest labor intensity.
- Exclude staple crops produced purely for household consumption or processing plants with fixed corporate collection systems.
- Compile data on the length of the harvest window in weeks for every potential local crop.
- Measure the labor time in minutes required to manually harvest one kilogram of each crop.
- Construct a standardized Opportunity for Theft Index that increases with harvest window length and decreases with harvest time per kilogram.
- Split potential crops at the median index score into high-expected-theft and low-expected-theft categories for empirical analysis.
Why it works
Standardizing these physical traits removes subjective recall bias and isolates structural security vulnerabilities.
Example
A researcher compiled crop characteristics with a local farmer coordinator across 18 crops in Migori County, Kenya. High-theft crops like kale had 24-week harvest windows and required 3 minutes per kilogram, yielding index scores up to 3.79, whereas cassava had negative index scores.
About the study
Participants
18 agricultural crops evaluated across 585 smallholding households in 76 villages in Migori County, Kenya.
Study Design
Objective index construction combining local expert data on harvest window lengths and harvest labor times, followed by median-split classification to evaluate yield decomposition in a cluster-randomized trial.
Results
Applying the index revealed that security intervention yield gains were driven by low-expected-theft crops, which increased by 8,421 KES per acre (p < 0.05), compared to a statistically insignificant 1,444 KES increase for high-expected-theft crops.