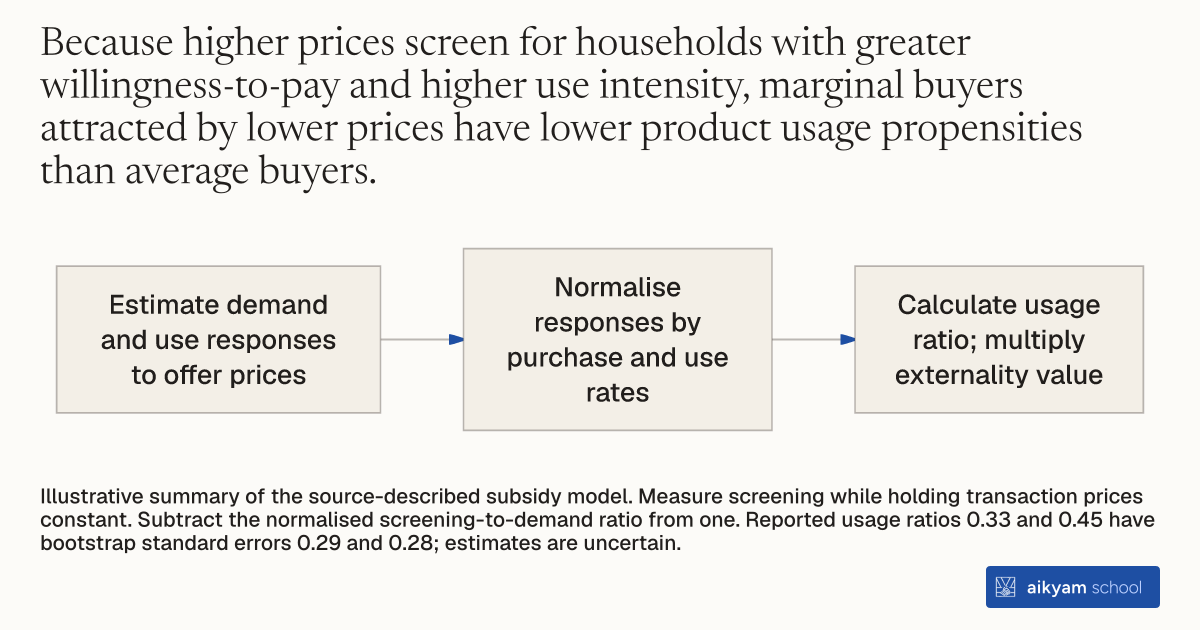
Research steps
Adjust a subsidy for buyer screening
- Estimate demand and use responses to offer prices
- Normalise responses by purchase and use rates
- Calculate usage ratio; multiply externality value
Illustrative summary of the source-described subsidy model. Measure screening while holding transaction prices constant. Subtract the normalised screening-to-demand ratio from one. Reported usage ratios 0.33 and 0.45 have bootstrap standard errors 0.29 and 0.28; estimates are uncertain.
See source →How
When to use
Public health organizations subsidizing health products often assume that new buyers attracted by lower prices use products at the same rate as existing buyers. Ignoring price screening leads policy makers to over-subsidize goods when marginal buyers use products less than average buyers. This method calculates the optimal Pigouvian health product subsidy by incorporating empirical buyer screening rates.
Calculate optimal public health product subsidies by adjusting standard Pigouvian formulas for empirical price screening elasticity.
- A policy analyst estimates the price elasticity of consumer demand by measuring purchase rates across randomized promotional price tiers.
- The analyst estimates the price screening elasticity by measuring product usage rates among buyers across offer price tiers while holding transaction prices constant.
- The analyst normalizes the price screening elasticity by dividing it by the average product usage rate among buyers.
- The analyst normalizes the price elasticity of demand by dividing it by the average purchase rate across target households.
- The analyst divides the normalized screening elasticity by the normalized demand elasticity and subtracts the quotient from one to calculate the marginal-to-average usage ratio lambda.
- The analyst multiplies the baseline health externality value by the calculated lambda ratio to establish the screening-adjusted Pigouvian product subsidy.
Why it works
Adjusting the subsidy by the marginal-to-average usage ratio ensures public funds reflect the actual health externality produced at the margin.
Example
Economists in Lusaka, Zambia, evaluated the optimal subsidy for Clorin water disinfectant using demand elasticity (-0.0664) and screening elasticity (+0.0321 to +0.0373). The resulting marginal-to-average usage ratio lambda of 0.33 for self-reported use and 0.45 for measured chlorination demonstrated that accounting for buyer screening reduces the optimal health subsidy by 50 to 67 percent compared to unadjusted models.
About the study
Participants
1,260 female heads of household across five low-income periurban compounds in Lusaka, Zambia.
Study Design
Policy simulation model integrating empirical demand and usage elasticities estimated from a randomized two-stage pricing field experiment (offer prices 300 to 800 kwacha) with objective chemical test-strip water audits two weeks post-purchase.
Results
The marginal-to-average user drinking water usage ratio lambda was estimated at 0.33 for self-reported usage and 0.45 for measured chlorination, with bootstrapped standard errors of 0.29 and 0.28. Incorporating buyer screening reduces the optimal health subsidy by 50 percent to 67 percent relative to models assuming identical marginal and average usage.