Research design
Survey experience after the pricing pilot
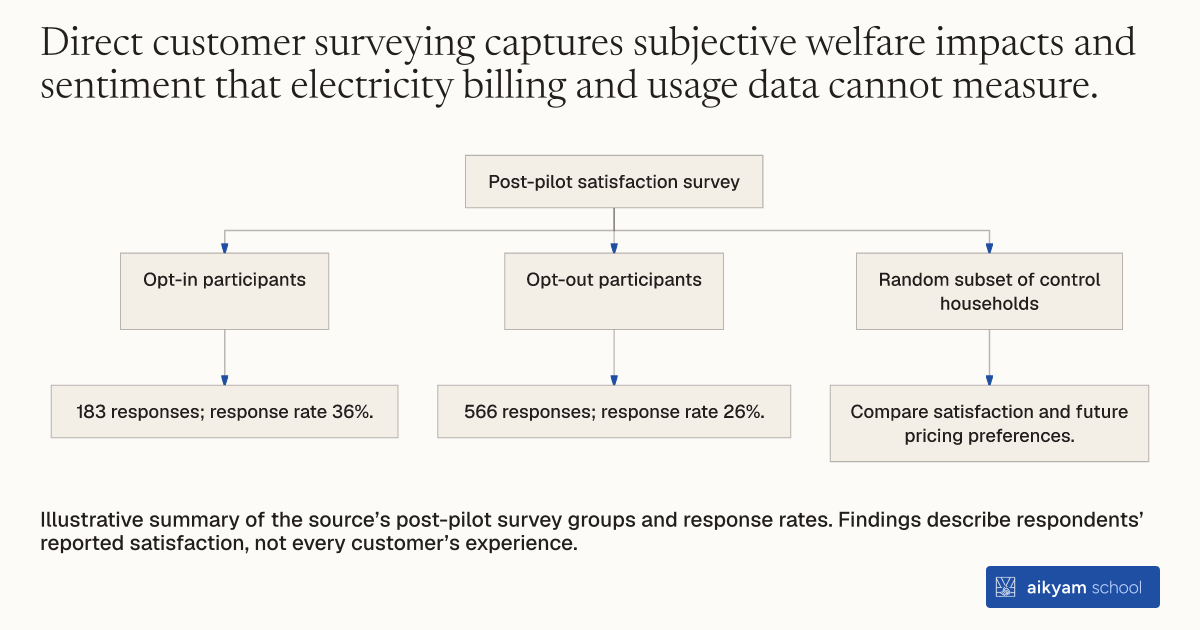
Post-pilot satisfaction survey
- Opt-in participants
- 183 responses; response rate 36%.
- Opt-out participants
- 566 responses; response rate 26%.
- Random subset of control households
- Compare satisfaction and future pricing preferences.
Illustrative summary of the source’s post-pilot survey groups and response rates. Findings describe respondents’ reported satisfaction, not every customer’s experience.
See source →How
When to use
Program evaluators and electric utility managers need to assess end-user satisfaction and perceived welfare after implementing time-varying electricity rates. Defaulting consumers onto new tariffs can raise concerns about customer backlash or hidden dissatisfaction. Conducting structured end-line surveys among treated and control households measures actual consumer sentiment, self-reported plan satisfaction, and ongoing tariff preference.
Administer a post-pilot survey across participant treatment arms and control households to evaluate customer satisfaction and program attitudes.
- Survey designers draft standardized questionnaires covering program experience, satisfaction levels, and future pricing preferences after the experimental pilot concludes.
- Program evaluators distribute the end-line survey to all enrolled CPP and TOU participants across opt-in and opt-out treatment groups as well as a randomized subset of control households.
- Operations staff collect and process returned survey responses via mail or online portals, achieving response rates of 36 percent among opt-in participants and 26 percent among opt-out participants.
- Data analysts compile customer satisfaction metrics, comparing response distributions across satisfaction categories and plan retention preferences between treatment and control groups.
Why it works
Comparing satisfaction across opt-in, default opt-out, and control groups reveals whether automatic enrollment damages institutional trust or consumer sentiment.
Example
SMUD surveyed participants and control customers in Sacramento, California after the pricing pilot concluded, finding that nearly 90 percent of opt-out participants reported being very or somewhat satisfied with their plan, compared to 80 percent of control customers on standard rates.
About the study
Participants
749 surveyed participants (566 opt-out enrollees and 183 opt-in enrollees) plus control respondents in Sacramento, California.
Study Design
Post-experiment end-line survey evaluating self-reported customer satisfaction and plan retention preferences across treatment and control groups.
Results
Response rates reached 36 percent (N = 183) for opt-in enrollees and 26 percent (N = 566) for opt-out enrollees, with almost 90 percent of time-varying pricing respondents reporting being very or somewhat satisfied compared to 80 percent in the control group, and fewer than 7 percent expressing disagreement with staying on their plan.