Try, learn and adjust
Check pictograms explain the application process
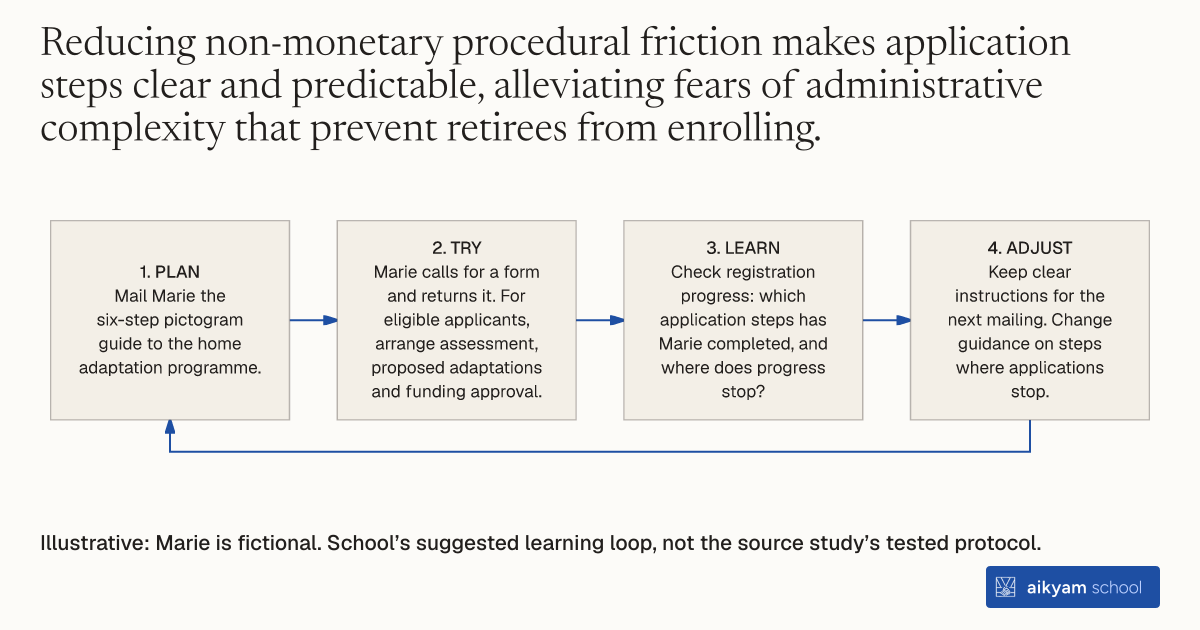
- Plan: Mail Marie the six-step pictogram guide to the home adaptation programme.
- Try: Marie calls for a form and returns it. For eligible applicants, arrange assessment, proposed adaptations and funding approval.
- Learn: Check registration progress: which application steps has Marie completed, and where does progress stop?
- Adjust: Keep clear instructions for the next mailing. Change guidance on steps where applications stop.
Illustrative: Marie is fictional. School’s suggested learning loop, not the source study’s tested protocol.
See source →School’s suggested, untested loop. Observe calls, returned forms and progress through assessment and funding approval.
How
When to use
Elderly retirees often hesitate to participate in home safety programs due to unclear application requirements and fears of complex administrative burdens. This method uses clear pictograms and a simplified step-by-step visual workflow to reduce non-monetary procedural friction. It is designed for public social agencies aiming to boost program enrollment among older adults without relying solely on financial subsidies.
Clarify and illustrate the multi-step application workflow using intuitive visual pictograms and sequential instructions.
- The social agency mails outreach brochures that display a six-step visual roadmap with numbered pictograms detailing the program process.
- The retiree calls a designated toll-free telephone number to request an application file.
- The retiree fills out the application form and mails it back to the agency.
- An agency assessor contacts eligible retirees to schedule a home visit.
- The assessor inspects the living space, identifies housing hazards, and proposes customized safety adaptations.
- The agency calculates means-tested cost coverage and approves the funding for approved home modifications.
Example
In Île-de-France, CNAV mailed Brochure 7 featuring step-by-step pictograms to 3,005 retirees, which achieved a 1.40% program registration rate compared to 0.93% in the control group.
About the study
Participants
48,090 retired individuals living in Île-de-France (Paris region), France; 3,005 received Brochure 7 featuring procedural pictograms.
Study Design
Randomized controlled trial (field experiment) evaluating the reduction of non-monetary procedural costs via visual process guides and tracking PAP registration over 17 months.
Results
Explaining the registration process with pictograms increased program registration by 0.47 percentage points (from 0.93% in the control group to 1.40%, a 51% relative increase), achieving over 60% of the gain generated by a 100% subsidy.