Research procedure
Reweight the reference population
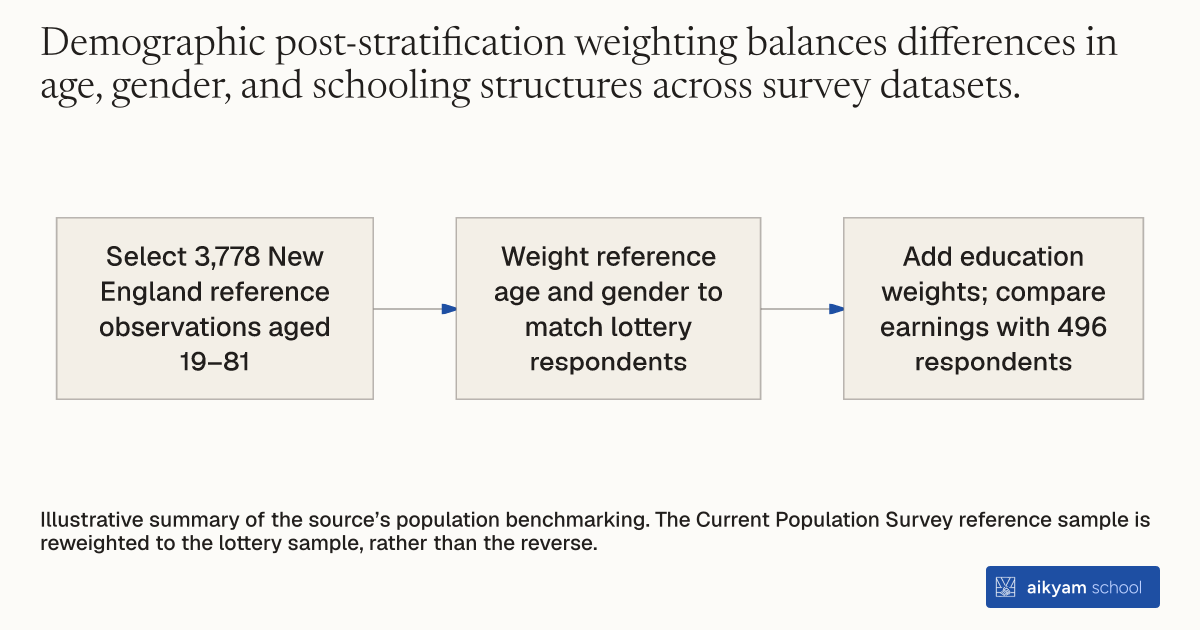
- Select 3,778 New England reference observations aged 19–81
- Weight reference age and gender to match lottery respondents
- Add education weights; compare earnings with 496 respondents
Illustrative summary of the source’s population benchmarking. The Current Population Survey reference sample is reweighted to the lottery sample, rather than the reverse.
See source →How
When to use
Survey researchers need to evaluate whether specialized study samples accurately represent the broader general population. Specialized cohorts often exhibit non-random demographic participation patterns that create sampling biases. Re-weighting sample observations using broad reference population benchmarks allows researchers to test representativeness and measure selection differences.
Weight survey sample observations using joint demographic distributions from representative population databases to match key demographic traits.
- Extract demographic variables including age, gender, and completed schooling years from a representative population survey.
- Restrict the reference population sample to match the geographic region and age boundaries of the study dataset.
- Compute baseline demographic means across gender, age, and education levels for both raw datasets.
- Construct sampling weights that align the age and gender proportions of the reference dataset with the study sample.
- Apply expanded post-stratification weights incorporating education levels alongside age and gender to compare matched economic outcomes.
Why it works
Controlling for key demographic covariates reveals whether observed outcome differences stem from sample selection or underlying behavioral shifts.
Example
Researchers compared 496 Massachusetts lottery survey respondents against 3,778 Current Population Survey observations from New England. Weighting the Current Population Survey sample to match the lottery sample age, gender, and education distributions increased reference average earnings from 11,600 dollars to 17,100 dollars, showing that lottery players earned lower relative wages conditional on education.
About the study
Participants
496 lottery survey respondents in Massachusetts compared against 3,778 Current Population Survey observations from New England aged 19 to 81.
Study Design
Cross-sectional post-stratification re-weighting matching age and gender distributions (CPS-I) and education distributions (CPS-II), evaluated alongside Mincerian earnings regressions.
Results
Post-stratification weighting on age and gender increased reference population earnings from 11,600 dollars to 15,000 dollars, and adding education weighting increased reference earnings to 17,100 dollars, while estimated returns to education remained consistent across samples (7.7 percent versus 8.2 percent).