Try, learn and adjust
Check registration after risk-gap messaging
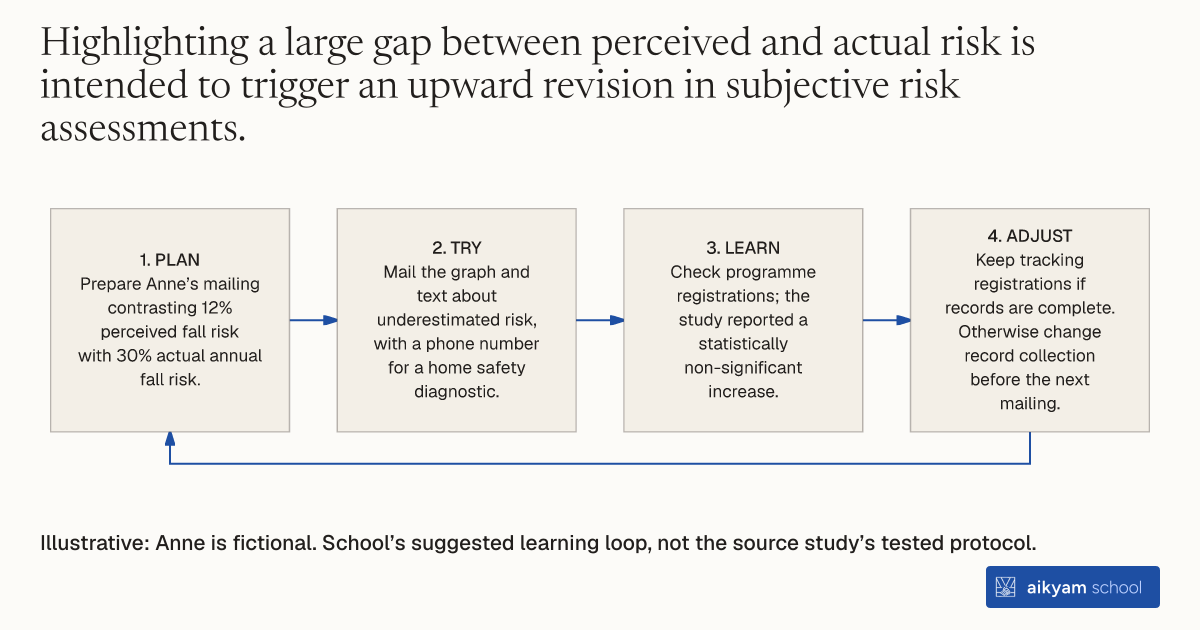
- Plan: Prepare Anne’s mailing contrasting 12% perceived fall risk with 30% actual annual fall risk.
- Try: Mail the graph and text about underestimated risk, with a phone number for a home safety diagnostic.
- Learn: Check programme registrations; the study reported a statistically non-significant increase.
- Adjust: Keep tracking registrations if records are complete. Otherwise change record collection before the next mailing.
Illustrative: Anne is fictional. School’s suggested learning loop, not the source study’s tested protocol.
See source →School’s suggested learning loop: observe registration after the source-described mailing; do not assume risk-gap messaging increases demand.
How
When to use
Elderly retirees often under-evaluate personal fall risks, assuming accidents are rare or unlikely to affect them. This method presents side-by-side comparative graphics that highlight the large discrepancy between low perceived fall risks and high objective population fall statistics. It is designed for public health agencies attempting to correct subjective risk underestimation and spur preventive home modifications.
Deliver educational mailings featuring comparative graphs that contrast low subjective risk perceptions with high actual risk figures.
- Gather official health statistics showing that 30% of seniors fall annually and 10% experience severe medical complications.
- Collect survey data demonstrating that only 12% of pensioners believe they face a high fall risk and 4% anticipate serious consequences.
- Construct a column chart displaying the 12% perceived fall risk bar alongside the 30% true fall risk bar.
- Add text highlighting that many pensioners underestimate household fall risks and potential injuries.
- Provide a direct phone line to the social security agency for retirees to request a free or subsidized home safety diagnostic.
Why it works
However, if retirees perceive the discrepancy as evidence of widespread measurement ambiguity rather than personal vulnerability, the messaging fails to generate increased demand.
Example
In Île-de-France, CNAV mailed Brochure 13 (showing a 12% perceived risk vs. 30% true risk gap) to 3,005 retirees, resulting in a 1.13% program registration rate compared to 0.93% in the control group.
About the study
Participants
48,090 retired individuals living in Île-de-France (Paris region), France; 3,005 received Brochure 13 showing risk underestimation graphics.
Study Design
Randomized controlled trial (field experiment) testing side-by-side risk gap graphics and tracking PAP program registration over a 17-month period.
Results
Highlighting the risk underestimation gap increased program registration by 0.20 percentage points (from 0.93% in the control group to 1.13%), but this effect was statistically non-significant (p = 0.359, FDR p-value = 22.2%).