Research steps
Predict responses with separate sample halves
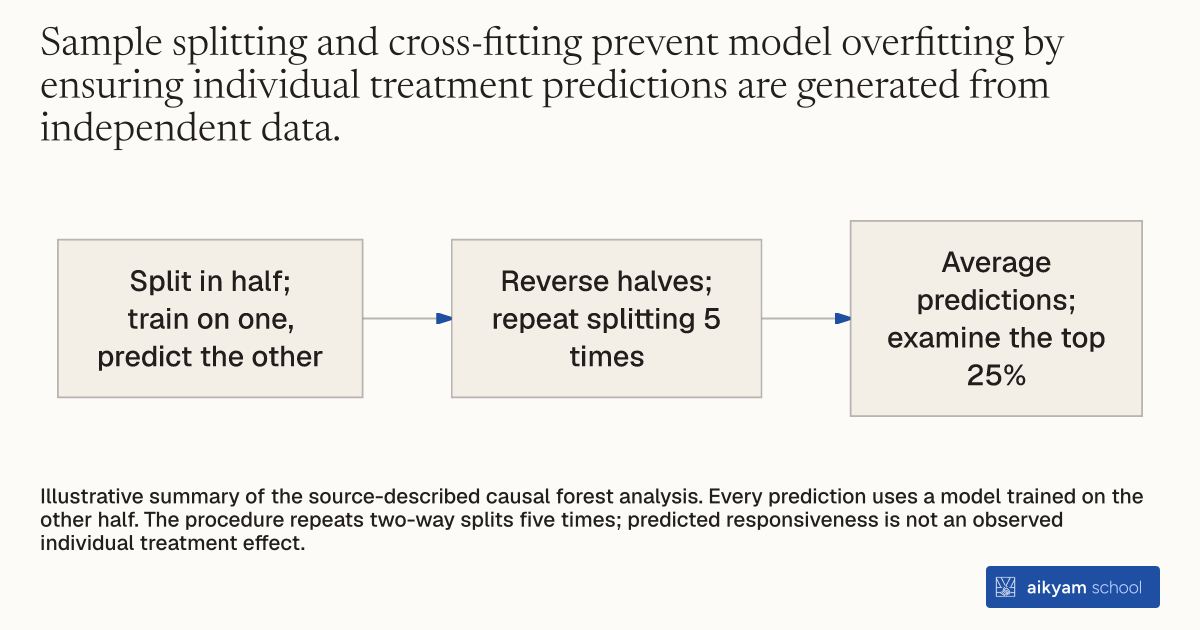
- Split in half; train on one, predict the other
- Reverse halves; repeat splitting 5 times
- Average predictions; examine the top 25%
Illustrative summary of the source-described causal forest analysis. Every prediction uses a model trained on the other half. The procedure repeats two-way splits five times; predicted responsiveness is not an observed individual treatment effect.
See source →How
When to use
In randomized health evaluations, program impacts often vary widely across different demographic groups. Analysts want to identify which individuals benefit most from an intervention without cherry-picking subgroups after seeing the data. Applying a sample-splitting causal forest algorithm predicts individual treatment responsiveness using baseline characteristics while avoiding statistical overfitting.
Apply a machine learning causal forest algorithm with cross-fitting sample splits to predict individual treatment responsiveness across baseline characteristics.
- Split the evaluation sample into two equal halves to create complementary training and prediction datasets.
- Train a causal forest model on the first half of the sample using baseline demographic characteristics to estimate conditional average treatment effects.
- Predict individual treatment effects for respondents in the second half of the sample using the fitted model parameters.
- Reverse the roles of the two sample halves and predict individual treatment effects for the remaining respondents.
- Repeat the two-way sample splitting and prediction steps 5 times with different random data partitions.
- Calculate the average predicted treatment effect across all 5 iterations for every individual in the study panel.
- Isolate respondents in the top 25 percent of predicted treatment responsiveness to measure downstream health behavior and fertility outcomes.
Why it works
Averaging predictions across multiple random splits stabilizes algorithm variance and provides unbiased subgroup identification.
Example
In Burkina Faso, evaluators applied a causal forest algorithm across 6,728 women to predict individual modern contraceptive responsiveness to a 2.5-year radio campaign. Analysts split the sample 5 times to generate individual treatment predictions based on baseline age, education, and contraceptive history. Women in the top 25 percent of predicted responsiveness experienced a 3.4 percentage point reduction in annual births.
About the study
Participants
6,728 women across 252 rural villages in 16 radio station clusters in Burkina Faso.
Study Design
Causal forest machine learning algorithm with 5-fold cross-fitting sample splits applied to cluster RCT panel survey data.
Results
Isolating the top 25 percent of women with the largest predicted treatment response revealed a 3.4 percentage point reduction in childbirths over the preceding 12 months (p-value = 0.038).