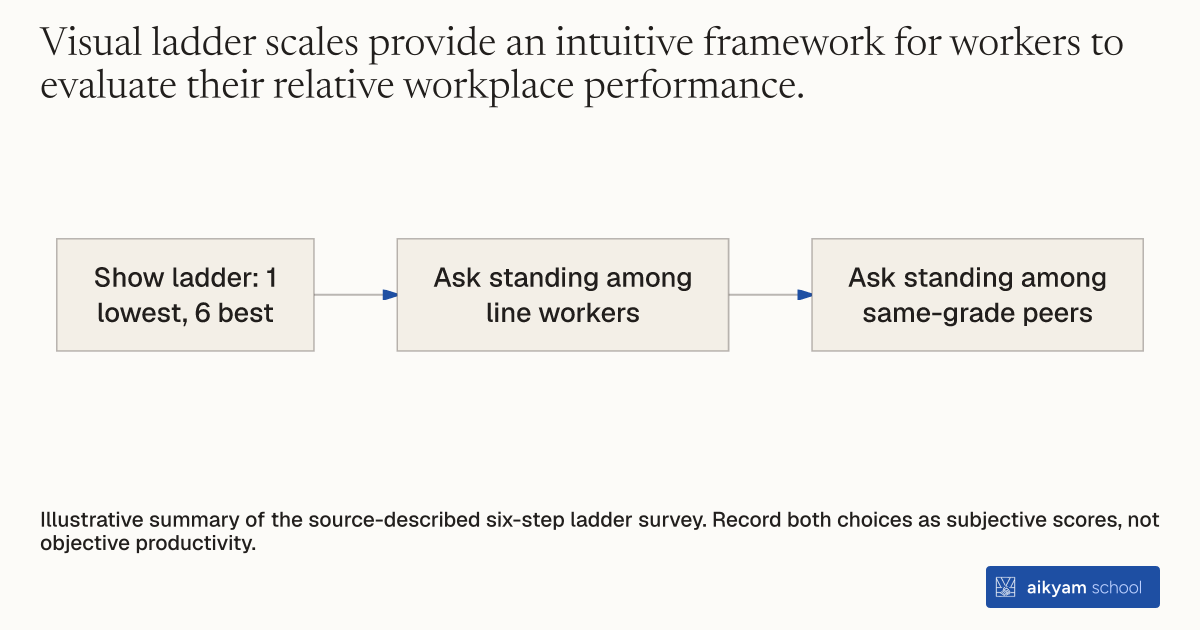
Research steps
Record perceived productivity standing
- Show ladder: 1 lowest, 6 best
- Ask standing among line workers
- Ask standing among same-grade peers
Illustrative summary of the source-described six-step ladder survey. Record both choices as subjective scores, not objective productivity.
See source →How
When to use
Measuring objective productivity alone fails to capture whether workplace interventions boost employee confidence and self-regard relative to peers. A lack of self-assessed standing can stifle initiative and career expectations among frontline factory workers. Administer a six-step ladder ranking tool to assess subjective productivity and peer comparison standing.
Administer a structured visual six-step ladder instrument during worker survey interviews to measure subjective peer productivity standing.
- Show the survey participant a diagram depicting a ladder with six numbered steps.
- Explain that step one represents the lowest productivity workers on the assembly line and step six represents the best workers.
- Ask the worker to select the step representing their own productivity relative to all workers on their production line.
- Ask the worker to select the step representing their own productivity relative to workers of the same technical skill grade.
- Record both numerical ladder choices as individual subjective peer standing scores.
Why it works
Soft skills training increases worker extraversion and self-regard, leading to higher self-assessments relative to technical peers.
Example
Researchers surveyed 621 female garment workers across five factories in Bengaluru, India using the six-step ladder tool at program completion. Soft skills training significantly increased workers' self-assessments relative to peers of the same technical skill grade by 0.158 steps.
About the study
Participants
621 female garment workers in the primary RCT survey sample across 5 export factories in Bengaluru, India.
Study Design
Randomized controlled trial assessing cross-sectional survey outcomes using retention inverse probability weighting and controls for age, tenure, education, and factory unit.
Results
Soft skills training produced a statistically significant increase of 0.158 steps in skill-peer self-assessment (p < 0.01; relative to a control group mean of 5.337) and a statistically insignificant increase of 0.0293 steps in overall line co-worker self-assessment (relative to a control group mean of 5.298).