Try, learn and adjust
Check the subsidy matches the retiree’s income
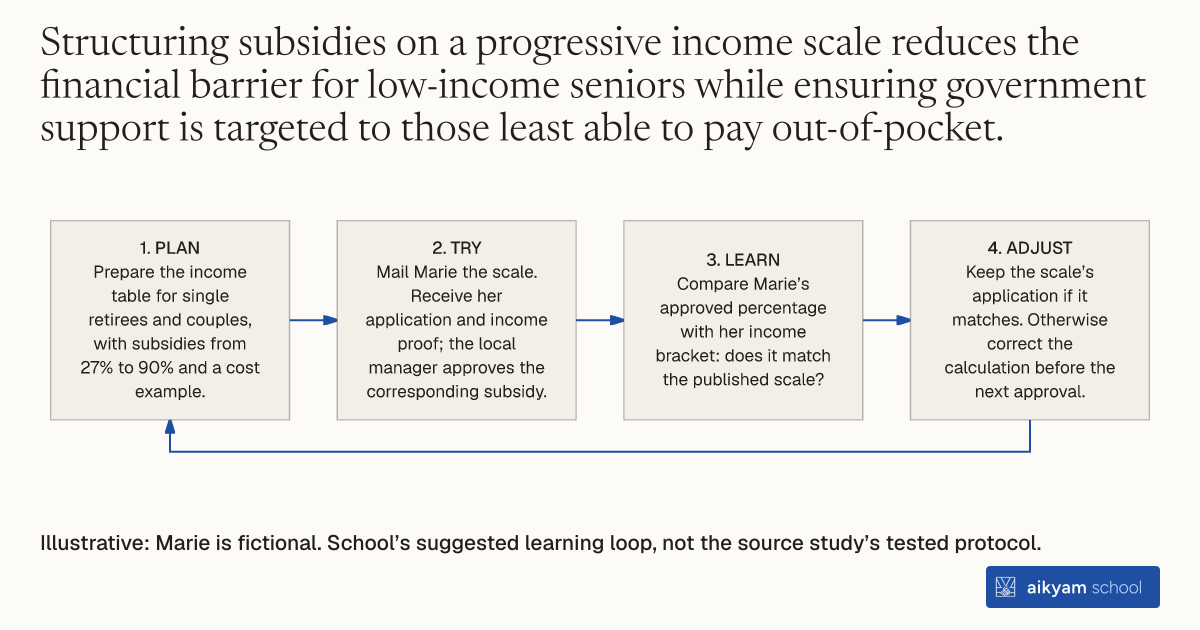
- Plan: Prepare the income table for single retirees and couples, with subsidies from 27% to 90% and a cost example.
- Try: Mail Marie the scale. Receive her application and income proof; the local manager approves the corresponding subsidy.
- Learn: Compare Marie’s approved percentage with her income bracket: does it match the published scale?
- Adjust: Keep the scale’s application if it matches. Otherwise correct the calculation before the next approval.
Illustrative: Marie is fictional. School’s suggested learning loop, not the source study’s tested protocol.
See source →School’s suggested, untested loop. Observe income proof, the applicable bracket and approved subsidy percentage.
How
When to use
Elderly retirees often delay necessary safety investments in their homes due to financial constraints and uncertain cost expectations. This method provides income-tiered financial support for preventive home modifications, offering larger subsidy percentages to lower-income retirees. It is designed for public social security agencies or municipal welfare funds seeking to target financial aid toward low-income seniors.
Present a clear income-based sliding scale table that determines the percentage of home adaptation costs subsidized by the agency.
- Define tiered monthly income brackets for single retirees and retired couples.
- Assign a co-funding subsidy percentage to each bracket, ranging from 27% for higher earners to 90% for lower earners.
- Mail the fee scale to target retirees along with a concrete numerical calculation example showing out-of-pocket costs.
- Require the retiree to apply for social assistance and submit proof of monthly income.
- Review the application and grant the corresponding subsidy percentage upon approval by the local program manager.
Why it works
Showing a transparent fee matrix with concrete cost examples helps retirees accurately calculate their co-payment and reduces financial uncertainty.
Example
In Île-de-France, CNAV mailed brochure 2 presenting the sliding subsidy scale (27% to 90% based on monthly revenue) to 3,006 retirees, resulting in a 1.29% program registration rate compared to 0.93% in the control group.
About the study
Participants
48,090 retired individuals living in Île-de-France (Paris region), France; 3,006 received Brochure 2 presenting the subsidy-income scheme.
Study Design
Randomized controlled trial (field experiment) mailing brochures with different incentive structures and tracking PAP program registration over a 17-month period.
Results
Presenting the income-based sliding scale increased program registration by 0.37 percentage points (from 0.93% baseline in the control group to 1.29%), though this effect was not statistically significant when adjusting for multiple testing (FDR p-value = 12.0%).