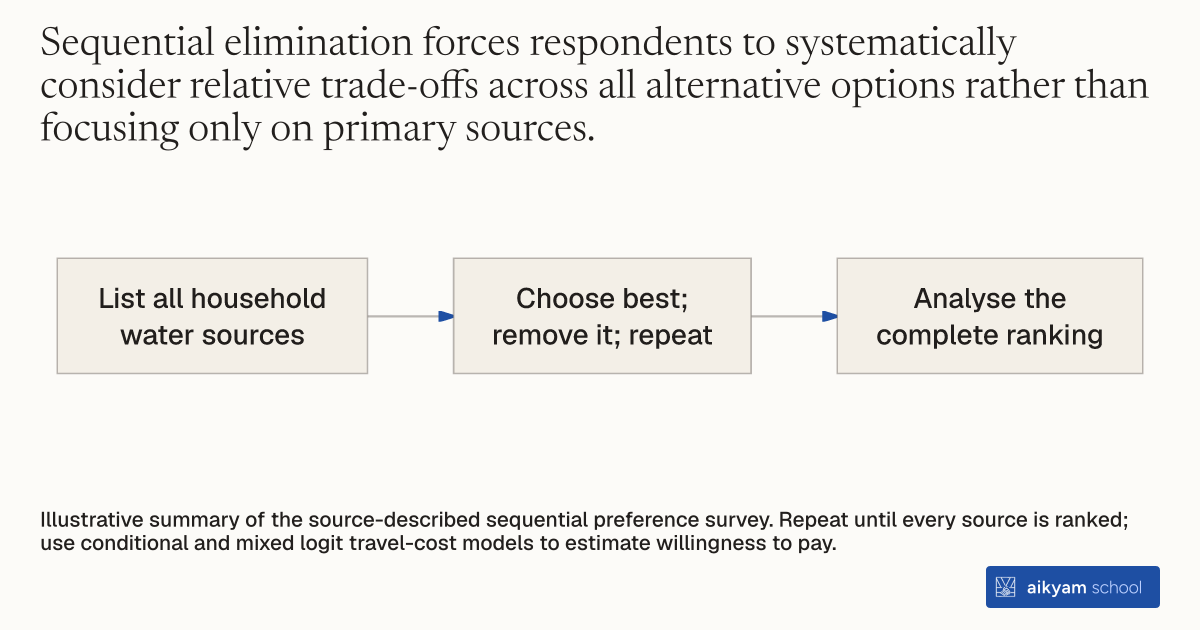
Research steps
Rank available water sources
- List all household water sources
- Choose best; remove it; repeat
- Analyse the complete ranking
Illustrative summary of the source-described sequential preference survey. Repeat until every source is ranked; use conditional and mixed logit travel-cost models to estimate willingness to pay.
See source →How
When to use
When evaluating environmental amenities or public infrastructure, observed market choices may be limited or incomplete. Evaluators need a survey-based methodology to capture how households value different source attributes. Sequential rank-ordering of potential water sources provides stated preference data for discrete choice travel cost modeling.
Elicit household water source preferences by having survey respondents rank available water sources sequentially.
- Survey enumerators ask respondents to identify all potential water sources available to their household.
- Enumerators ask respondents to select their single most preferred water source from the full set of options.
- Enumerators eliminate the selected top-ranked water source from the respondent's option list.
- Enumerators present the remaining subset of water sources and ask respondents to choose their next preferred option.
- Enumerators repeat this elimination step sequentially until every available water source is ranked.
- Econometricians analyze the sequential ranking data using conditional and mixed logit travel cost models to estimate willingness to pay.
Why it works
Analyzing full preference hierarchies within a travel cost framework allows researchers to estimate total household amenity valuation.
Example
Survey enumerators in Busia and Butere-Mumias districts of western Kenya administered sequential ranking surveys to 1,354 households in 2007, deriving an estimated mean annual willingness to pay for spring protection of 56.2 work days (4.96 US dollars).
About the study
Participants
1,354 households across 184 spring communities in Busia and Butere-Mumias districts, Kenya.
Study Design
Stated preference sequential ranking survey analyzed using conditional and mixed logit discrete choice models with measurement error adjustments for walking distance.
Results
Stated preference ranking yielded a mean annual valuation of 56.2 work days ($4.96 USD), which was nearly double the revealed preference estimate of 32.4 work days ($2.96 USD) due to social desirability bias and survey response noise.