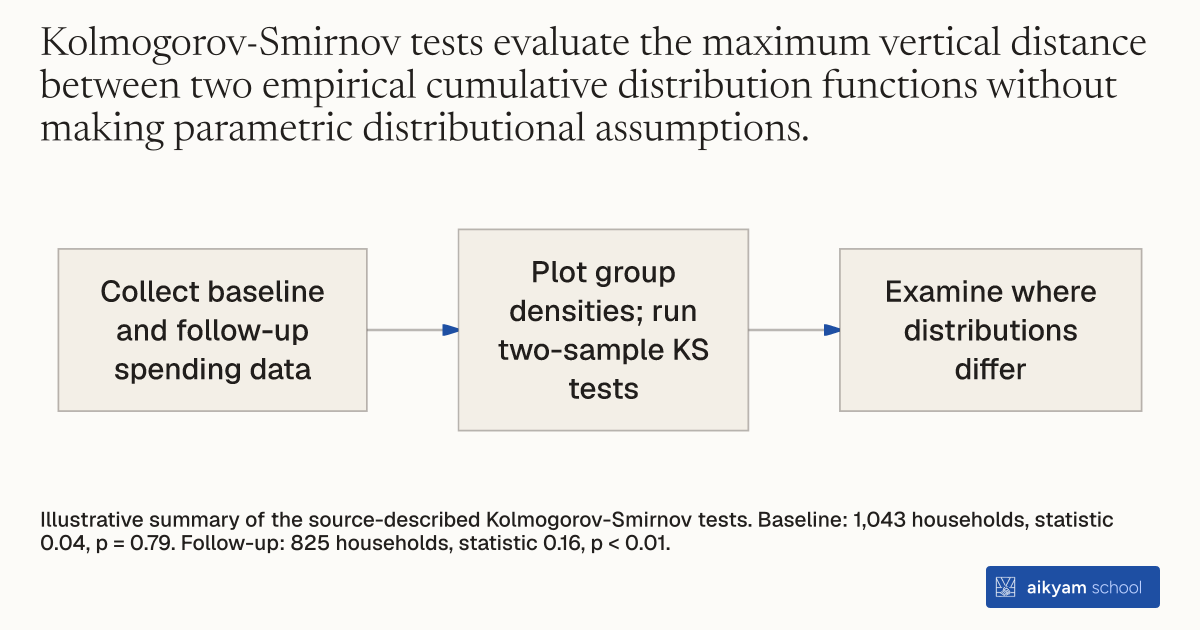
Research steps
Compare food budget share distributions
- Collect baseline and follow-up spending data
- Plot group densities; run two-sample KS tests
- Examine where distributions differ
Illustrative summary of the source-described Kolmogorov-Smirnov tests. Baseline: 1,043 households, statistic 0.04, p = 0.79. Follow-up: 825 households, statistic 0.16, p < 0.01.
See source →How
When to use
Mean expenditure comparisons across treatment arms can hide important shifts across the entire distribution of budget shares. Comparing overall distribution shapes reveals whether policy interventions shift budget shares for specific subgroups, such as low-income or high-spending households. Applying non-parametric Kolmogorov-Smirnov tests evaluates whether two empirical budget share distributions differ significantly across their entire support.
Test for shifts across full budget share distributions using two-sample non-parametric Kolmogorov-Smirnov tests.
- Collect household expenditure survey data on non-durable goods like food at baseline and follow-up rounds.
- Fit non-parametric Kernel densities for budget shares separately across treatment and control municipality groups.
- Calculate the two-sample Kolmogorov-Smirnov test statistic comparing the empirical cumulative distribution functions.
- Derive p-values to test the null hypothesis that budget share distributions are identical between treatment arms.
- Identify specific distribution segments, such as households spending above 35 percent on food, driving distribution shifts.
Why it works
Non-parametric density plots surface localized distributional shifts that simple mean comparisons mask.
Example
In Macedonia, evaluators estimated food budget share distributions for 1043 households at baseline and 825 households at follow-up across 84 municipalities. At baseline, the two-sample Kolmogorov-Smirnov test statistic was 0.04 with a p-value of 0.79, confirming identical baseline distributions. At follow-up, the test statistic rose to 0.16 with a p-value below 0.01, rejecting equality and showing a rightward shift in food budget shares for mother-recipient municipalities.
About the study
Participants
1043 baseline households and 825 follow-up households across 84 randomized municipalities in Macedonia.
Study Design
Two-sample non-parametric Kolmogorov-Smirnov tests and Kernel density estimation comparing food budget share distributions between 42 mother-recipient and 42 household-head-recipient municipalities at baseline (2010) and follow-up (2012).
Results
At baseline, the Kolmogorov-Smirnov test statistic was 0.04 (p-value = 0.79). At follow-up, the test statistic increased to 0.16 (p-value < 0.01), driven primarily by households allocating more than 35 percent of non-durable spending to food.