Research procedure
Estimate what managers value in appraisals
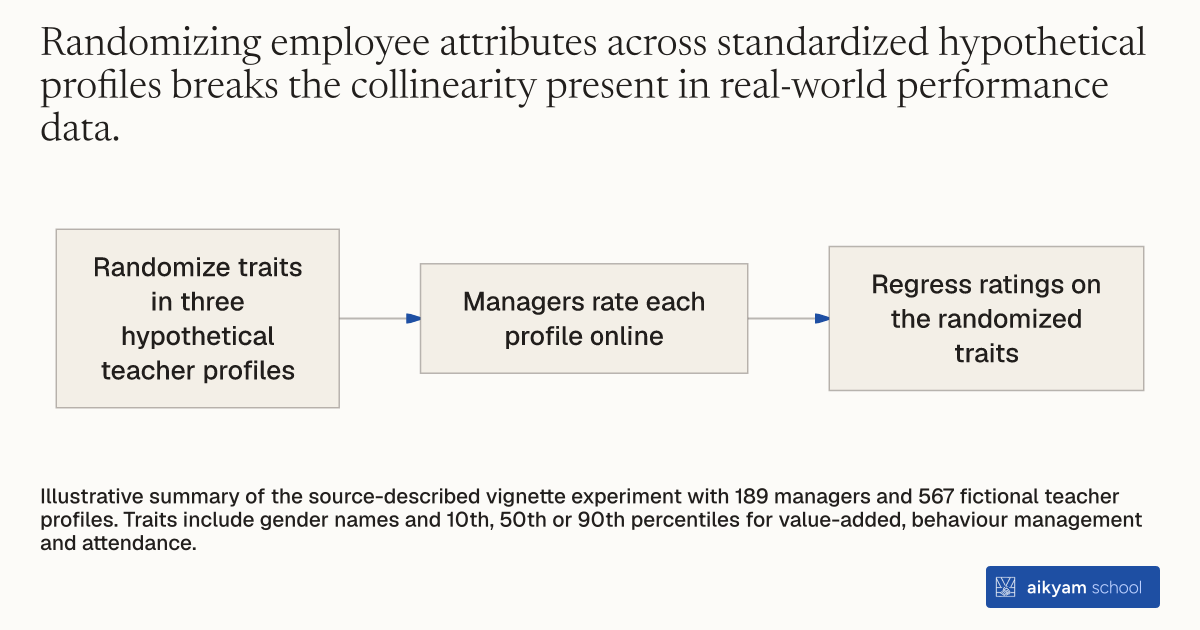
- Randomize traits in three hypothetical teacher profiles
- Managers rate each profile online
- Regress ratings on the randomized traits
Illustrative summary of the source-described vignette experiment with 189 managers and 567 fictional teacher profiles. Traits include gender names and 10th, 50th or 90th percentiles for value-added, behaviour management and attendance.
See source →How
When to use
Organizations face difficulty uncovering whether managers hold implicit biases or value specific worker characteristics when conducting performance appraisals. Direct survey questions often yield socially desirable answers that obscure true managerial preferences. Presenting managers with randomized hypothetical employee vignettes isolates how evaluators weigh output, behavior, attendance, and demographics.
Evaluate manager appraisal preferences by presenting evaluators with hypothetical employee vignettes that systematically randomize performance traits and demographic attributes.
- Construct three short hypothetical employee vignettes describing worker traits across key performance dimensions and demographic characteristics.
- Randomize worker attributes across vignettes, varying employee gender names, student test value-added percentiles, behavioral management percentiles, and attendance percentiles.
- Assign performance values at fixed benchmark percentiles corresponding to bottom, middle, and top performance tiers.
- Administer the randomized vignette experiment to school managers as part of an online endline survey.
- Require managers to assign a standardized performance rating score to each described employee vignette.
- Regress manager rating scores on vignette attributes to estimate the relative weight managers place on output, behavior, presence, and gender.
Why it works
This experimental approach allows researchers and human resource leaders to estimate true evaluator weights without confounding workplace factors.
Example
Researchers administered randomized vignettes to 189 school managers across private schools in Pakistan to test how managers weigh value-added, behavioral management, attendance, and gender. Managers placed twice as much weight on student test score growth as on behavioral management or attendance, increasing ratings by 0.7 standard deviations for top value-added workers.
About the study
Participants
189 school managers (principals and vice-principals; 61% female, average age 45) rating 567 hypothetical teacher vignettes in Pakistan.
Study Design
Survey experiment embedded in an endline survey where managers rated 3 hypothetical vignettes with randomly assigned percentiles (10th, 50th, 90th) for value-added, behavioral management, and attendance, alongside male or female names.
Results
Moving a teacher vignette from the 50th to 90th percentile in test value-added increased manager ratings by 0.70 standard deviations (p < 0.01), while 40-percentile increases in behavioral management and attendance increased ratings by 0.36 and 0.32 standard deviations respectively (p < 0.01), with female names having no statistically significant effect (-0.025 SD, p > 0.10).