Research measures
Read aggregate mobility measures
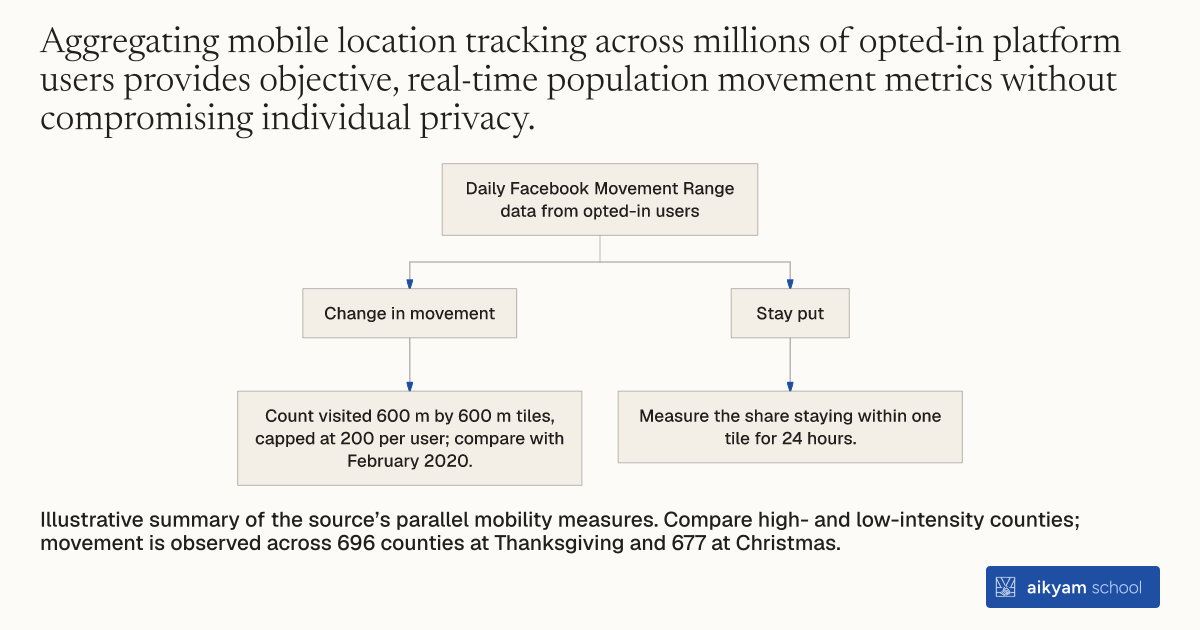
Daily Facebook Movement Range data from opted-in users
- Change in movement
- Count visited 600 m by 600 m tiles, capped at 200 per user; compare with February 2020.
- Stay put
- Measure the share staying within one tile for 24 hours.
Illustrative summary of the source’s parallel mobility measures. Compare high- and low-intensity counties; movement is observed across 696 counties at Thanksgiving and 677 at Christmas.
See source →How
When to use
Public health evaluations require measuring population movement across regions without surveying individuals or collecting private personal identifiable information. Direct self-reported travel surveys suffer from non-response, social desirability bias, and small sample sizes. Aggregated mobile phone location tracking enables researchers to observe population-level mobility changes before and after health campaigns.
Track population travel behavior using anonymized, aggregated mobile phone location metrics from social media users.
- Research teams access publicly available Facebook Movement Range dataset metrics aggregated daily from opted-in platform users.
- Analytics systems count Bing level-16 tile visits (600m by 600m areas) made by users starting in each county.
- Algorithms calculate the "Change in Movement" metric by summing visited tiles top-coded at 200 per user and scaling against February 2020 baseline levels.
- Analysts compute the "Stay Put" metric measuring the proportion of users who do not leave a single Bing tile for an entire 24-hour period.
- Econometricians apply ordinary least squares regressions comparing daily movement changes between high-intensity and low-intensity randomized county clusters.
Example
Researchers tracked daily movement across 696 counties during Thanksgiving and 677 counties during Christmas, measuring travel distance reductions across 34 million social media users in 13 US states.
About the study
Participants
Facebook users across 696 counties at Thanksgiving and 677 counties at Christmas in 13 US states.
Study Design
OLS regressions on daily aggregated Facebook Movement Range metrics comparing high-intensity and low-intensity county treatment arms during the 3 days preceding each holiday.
Results
Distance traveled in the 3 days before holidays decreased by 0.993 percentage points (P = 0.002) in high-intensity counties relative to low-intensity counties, while the proportion leaving home on holiday days showed no significant change (adjusted difference: 0.030 percentage points, P = 0.881).